Portfolio
Get Customized Software for your business. Make Accurate decisions with Data-driven services

Paid Ads Dashboards Optimizing Ad Campaign Performance and ROI
These dashboards provide valuable insights into ad impressions, clicks, conversions, and other key metrics, enabling marketers to make data-driven decisions and maximize the effectiveness of their social media ad strategies.
With social media paid ads dashboards, marketers can monitor the performance of their ad campaigns in real-time. They can track metrics such as click-through rates (CTRs), cost per click (CPC), and conversion rates, allowing them to gauge the success of their ad campaigns and make adjustments as needed. By analyzing these metrics, marketers can identify high-performing ad variations, optimize targeting parameters, and allocate budgets more effectively.
These dashboards also provide comprehensive data visualizations, allowing marketers to visualize the performance of their ad campaigns across different social media platforms. They can analyze the engagement levels, audience demographics, and geographic reach of their ads, helping them understand their target audience better and refine their ad targeting strategies.
Ads Performance Dashboard Examples

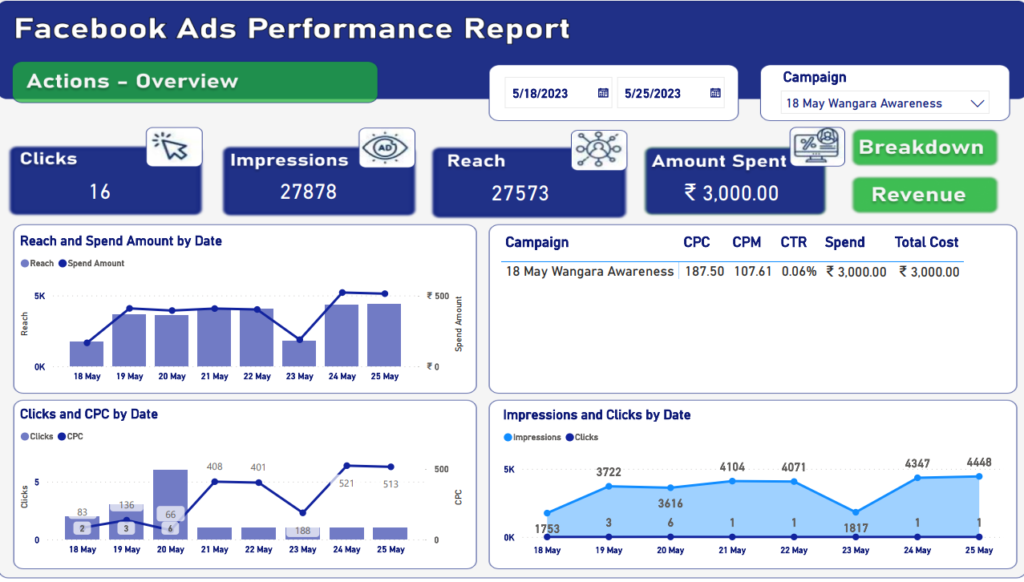
Facebook Ads Performance Report - Overview
It provides a comprehensive snapshot of key metrics for your Facebook ad campaigns. It includes metrics such as reach, impressions, and the amount spent. This dashboard allows you to quickly assess the overall performance of your campaigns, understand the visibility and exposure of your ads, and track your ad spend.

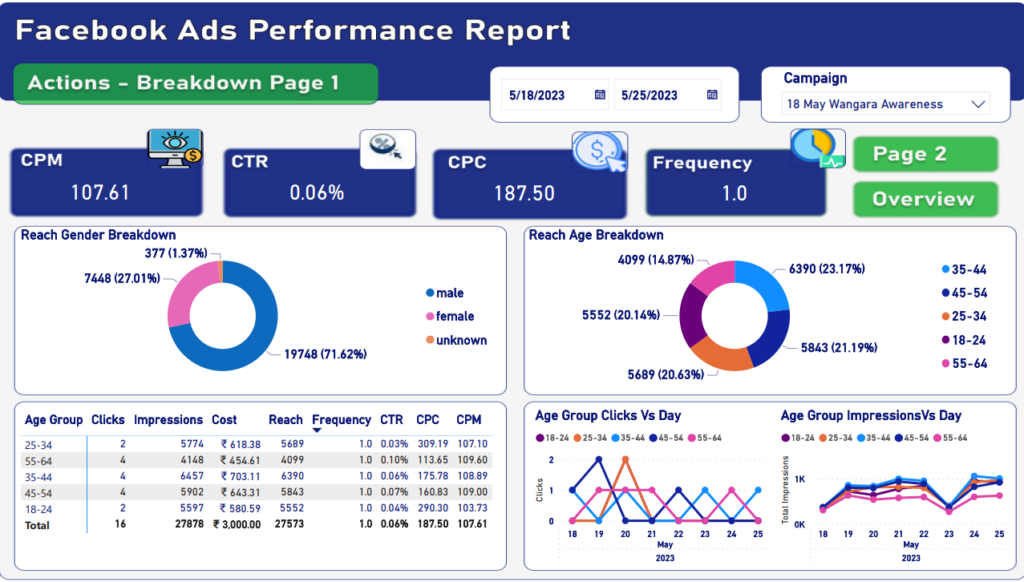
Facebook Ads Performance Report - Breakdown Page 1
These dives deeper into the performance of your Facebook ad campaigns. It includes metrics such as CPM (Cost Per Mille), CTR (Click-Through Rate), and CPC (Cost Per Click). This dashboard helps you analyze the efficiency and engagement of your ads, optimize your targeting and messaging strategies, and evaluate the cost-effectiveness of your campaigns.

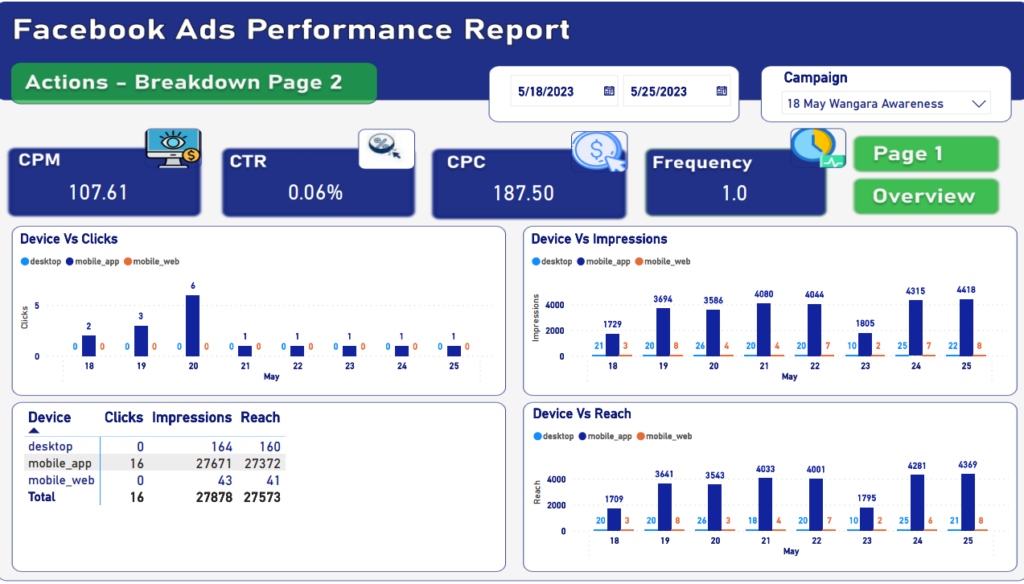
Facebook Ads Performance Report - Breakdown Page 2
It focuses on the performance of your Facebook ads across different devices. It provides insights into the number of clicks generated by each device category, allowing you to understand the device preferences of your target audience. This information helps you optimize your ad design and user experience for specific devices, ensuring maximum engagement and conversions.
Dashboards for Various Industries and Departments

Finance
Monitor your financial performance and gain insights into your investments and portfolios with dashboards

Service
Monitor your service performance, customer satisfaction, and resource utilization with dashboards

Google Analytics
Uncover actionable insights and improve online presence with powerful analytics dashboards

Marketing
Optimize production processes, reduce costs, and improve quality control with dashboards

Network and Hardware
Gain real-time visibility into network and hardware assets with interactive dashboards

Operations
Streamline processes and monitor performance with comprehensive operational dashboards

Customer Support
Enhance customer satisfaction and track support metrics with interactive support dashboards

Social Media Paids Ads
Optimize ad campaigns and track engagement with targeted social media dashboards


