Portfolio
Get Customized Software for your business. Make Accurate decisions with Data-driven services

Google Analytics Dashboard: Insights for Enhanced Digital Performance
The Google Analytics Dashboard offers invaluable insights for businesses looking to enhance their digital performance. It provides a comprehensive view of website metrics, user behavior, and marketing effectiveness. With intuitive visualizations and interactive charts, businesses can track traffic sources, monitor conversion rates, and optimize their digital strategies. Leveraging data-driven insights, businesses can make informed decisions, refine their marketing approach, and achieve remarkable online success. The Google Analytics Dashboard is an essential tool for maximizing digital performance and staying ahead in the competitive landscape.
Google Analytics Dashboard Examples
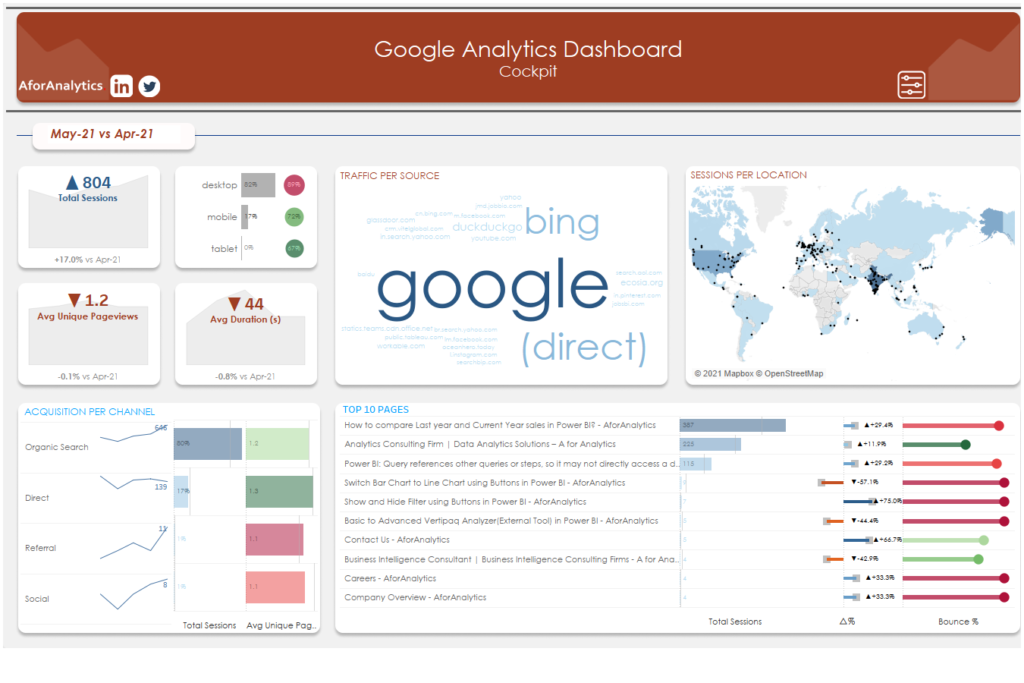
Cockpit - GA
The Cockpit-GA dashboard provides a comprehensive view of your website's performance using data from Google Analytics. Monitor key metrics such as traffic, user behavior, conversions, and more in one centralized dashboard, allowing you to gain valuable insights and make data-driven decisions to optimize your digital marketing strategies.
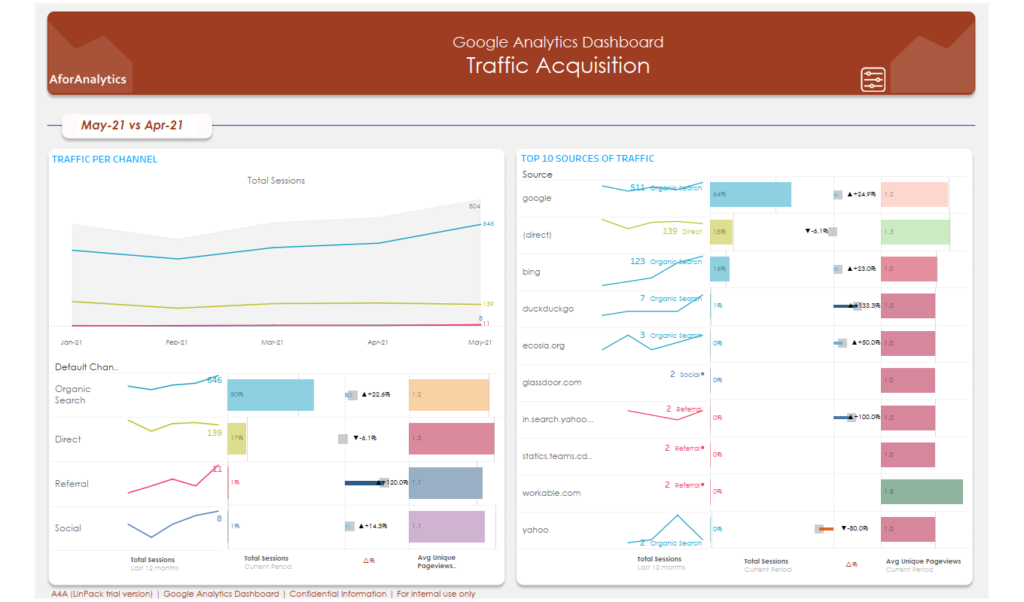
Acquisition
The Acquisition dashboard focuses on tracking and analyzing the sources and channels that drive traffic to your website. Gain insights into which marketing campaigns, search engines, or referral sites generate the most visits, conversions, and user engagement. This information helps you understand the effectiveness of your acquisition strategies and allocate resources accordingly.
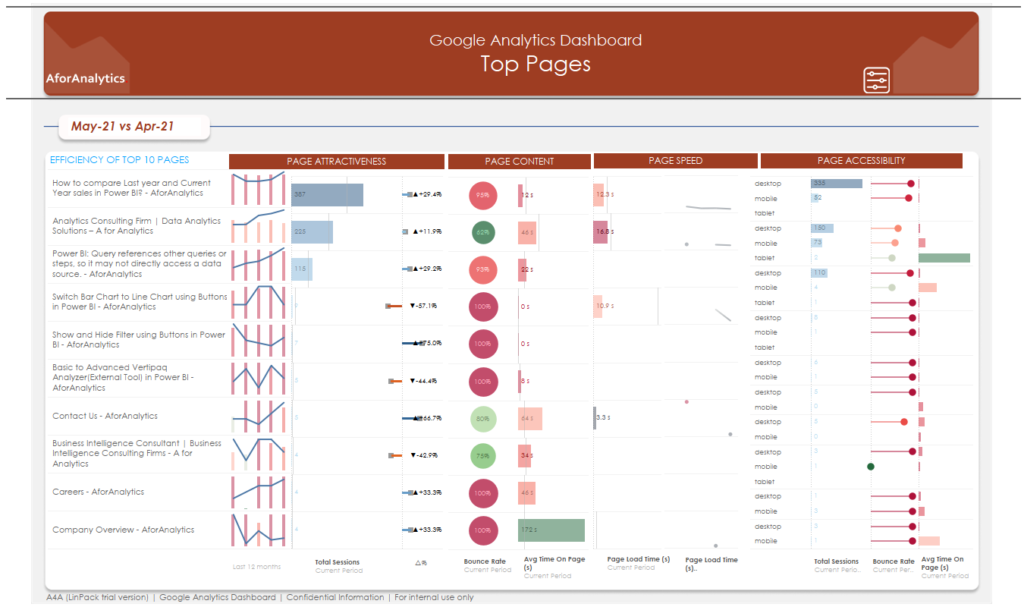
Top pages
The Top Pages dashboard allows you to identify the most popular and engaging pages on your website. Analyze metrics like page views, average time spent on page, bounce rate, and conversion rates for each page. By understanding which pages resonate most with your audience, you can optimize your content, improve user experience, and drive better results.
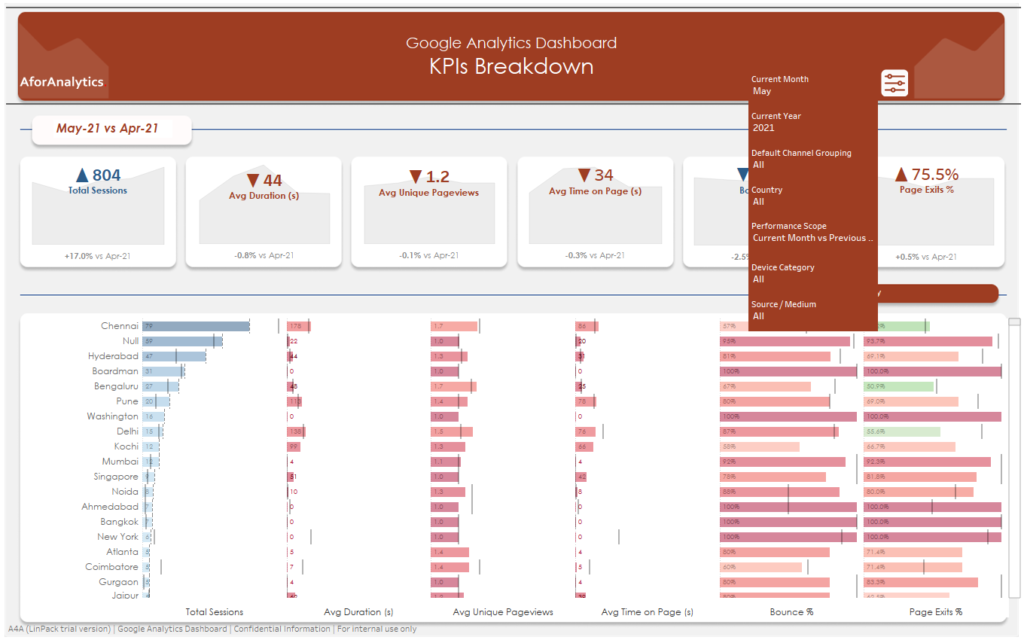
KPI Breakdown
Dive deep into your key performance indicators (KPIs) with the KPI Breakdown dashboard. Analyze and break down individual KPIs to understand their specific impact on your business goals. Visualize trends, compare performance against targets, and identify areas that require improvement to make informed decisions and optimize your digital marketing strategies.
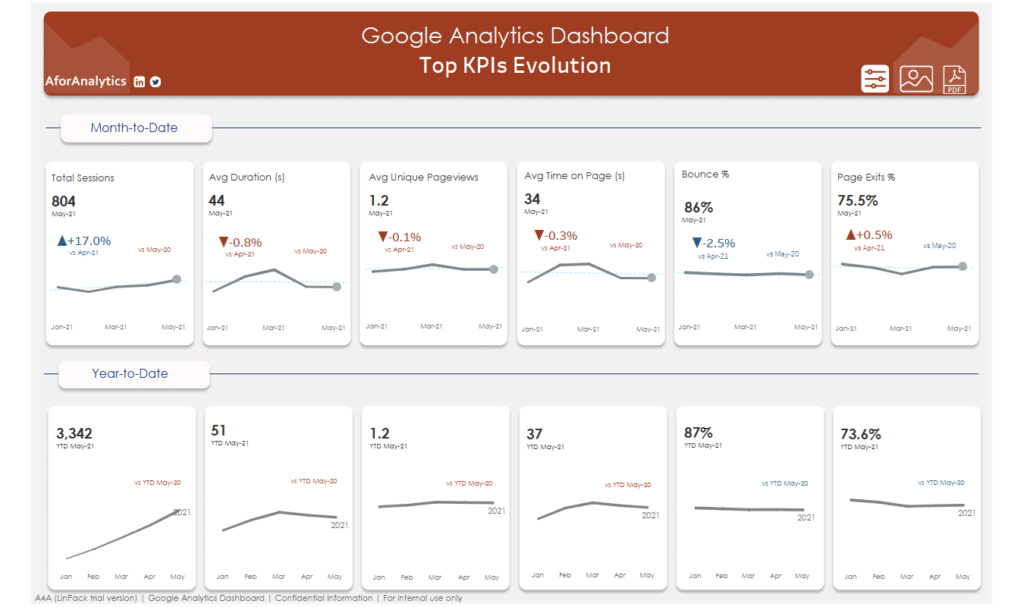
KPI Evaluation
The KPI Evaluation dashboard enables you to assess the performance of your KPIs over time. Track and measure progress towards your marketing objectives, set benchmarks, and visualize KPI trends. This analysis helps you identify areas of success and areas that need attention, allowing you to continuously refine your strategies for better results.
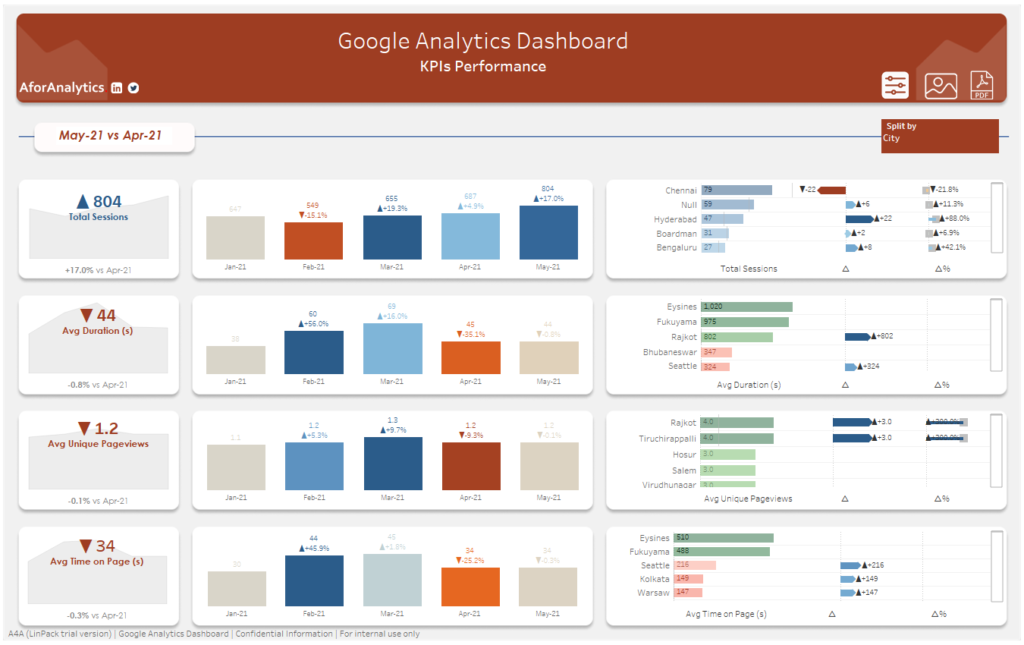
KPIs Performance cockpit
With the KPIs Performance Cockpit dashboard, you can monitor the performance of multiple KPIs simultaneously. Visualize trends, correlations, and overall performance metrics in a single view, empowering you to gain a comprehensive understanding of how your KPIs collectively impact your digital marketing efforts.
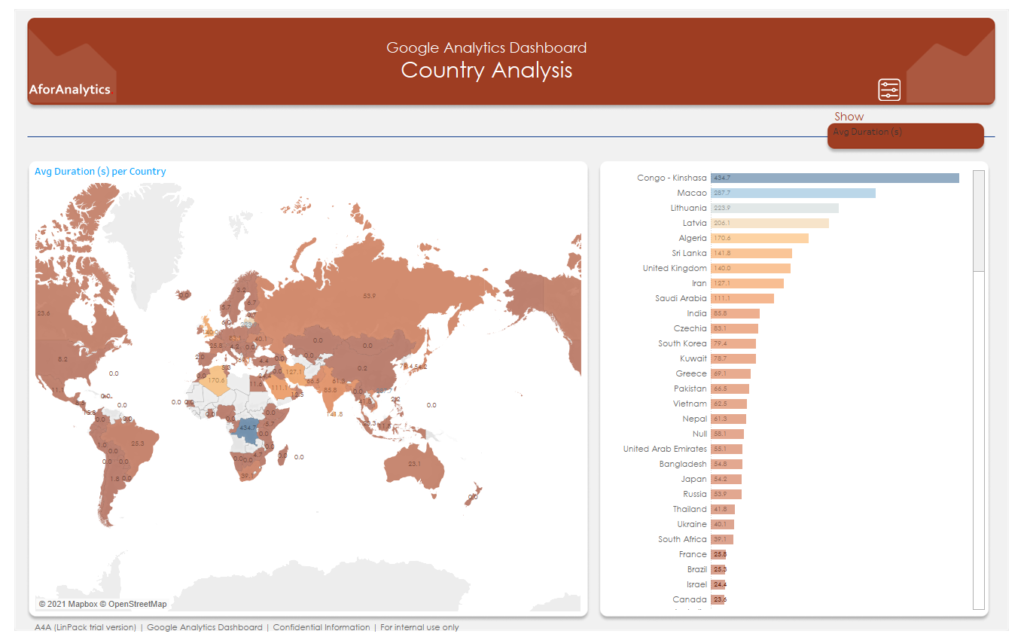
Analysis Country
The Analysis Country dashboard provides insights into website performance metrics based on the country of origin. Understand user behavior, conversion rates, and engagement levels specific to different countries. This information helps you tailor your marketing strategies, target specific regions, and optimize campaigns to better cater to the preferences and needs of different countries.
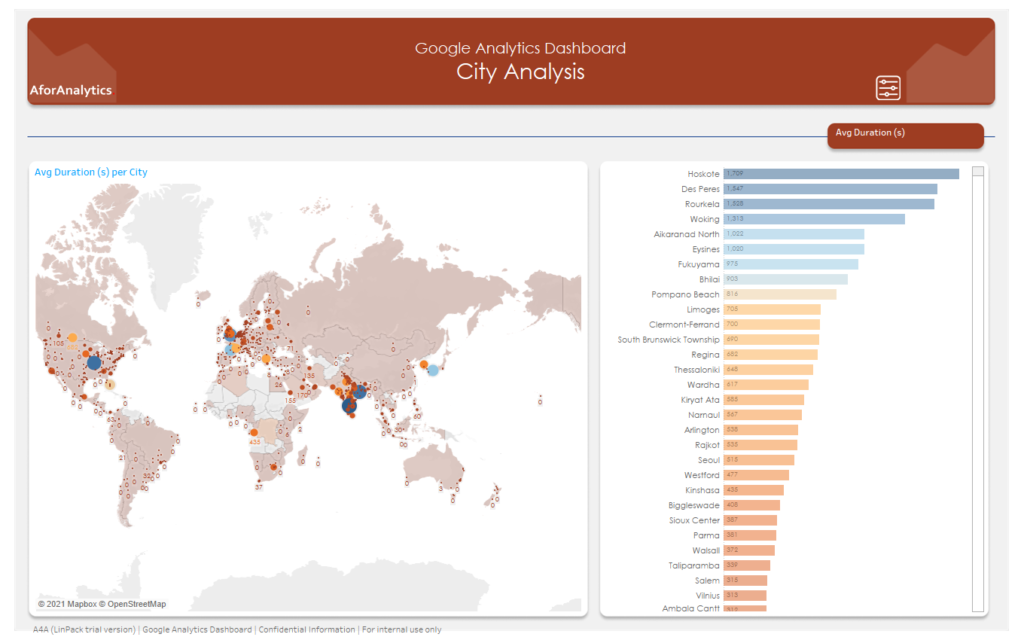
Analysis City
Gain detailed insights into website performance at the city level with the Analysis City dashboard. Understand user behavior patterns, conversion rates, and engagement metrics specific to different cities. This data allows you to identify high-performing regions, target local markets effectively, and refine your marketing initiatives based on city-specific data.
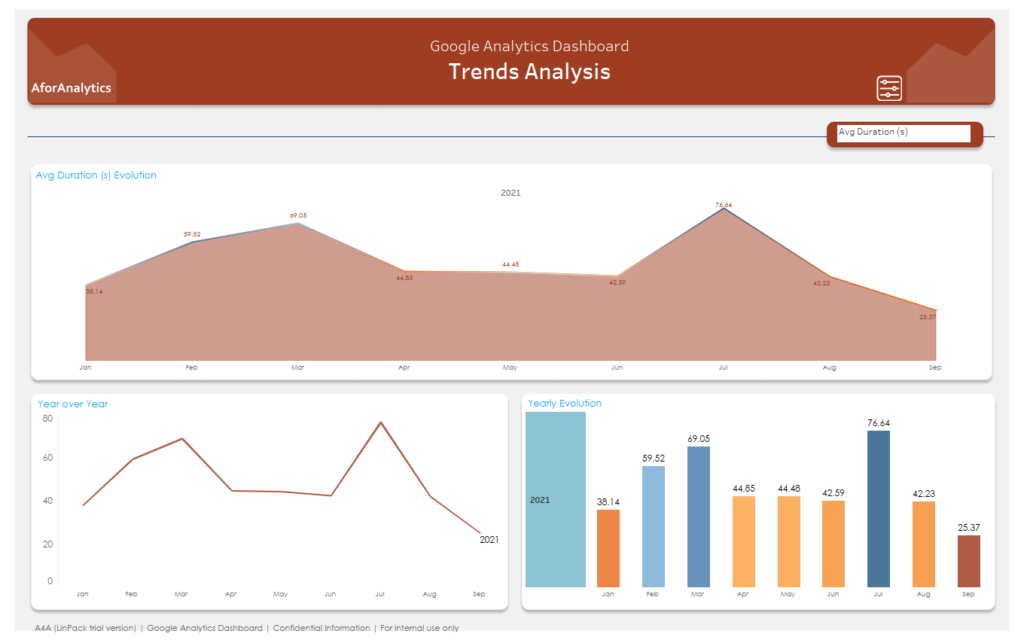
Analysis Trend
The Analysis Trend dashboard helps you uncover meaningful trends and patterns in your website's performance over time. Track changes in key metrics, identify seasonality, and discover emerging trends. This information enables you to make informed decisions and adjust your marketing strategies accordingly, maximizing the impact of your campaigns.
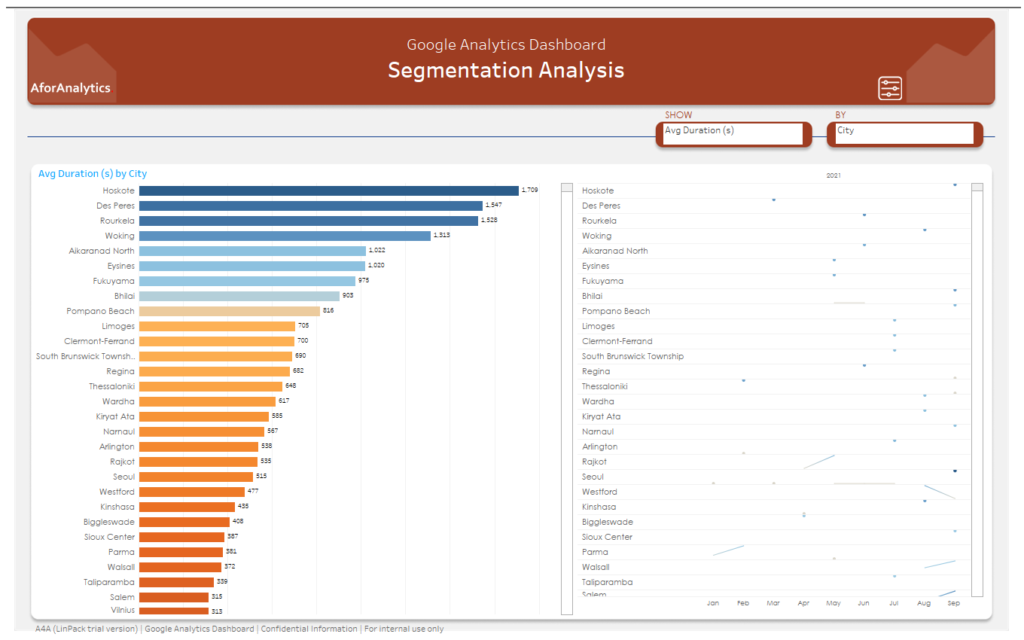
Analysis Segmentation
The Analysis Segmentation dashboard allows you to segment and analyze website performance data based on user demographics, behavior, or other criteria. Understand the characteristics and preferences of different audience segments to personalize marketing messages, improve targeting, and enhance the overall user experience.
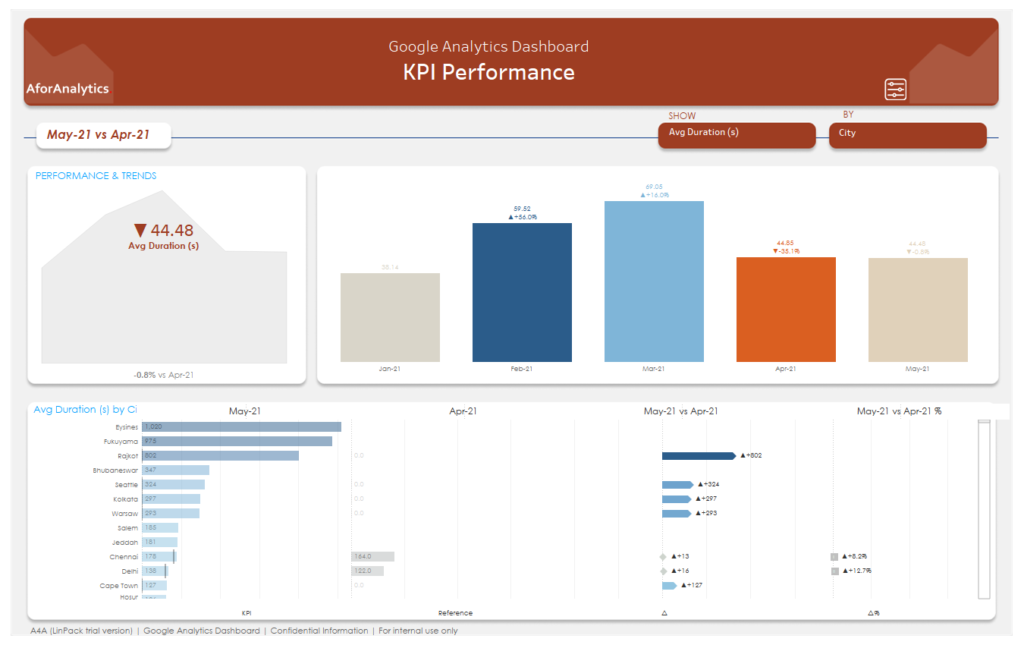
Analysis KPI performance
With the Analysis KPI Performance dashboard, you can evaluate the performance of your key performance indicators (KPIs) at a glance. Visualize KPI trends, compare against targets, and identify areas of strength and improvement. This information helps you optimize your digital marketing efforts, allocate resources effectively, and achieve your business objectives.
Dashboards for Various Industries and Departments

Finance
Monitor your financial performance and gain insights into your investments and portfolios with dashboards
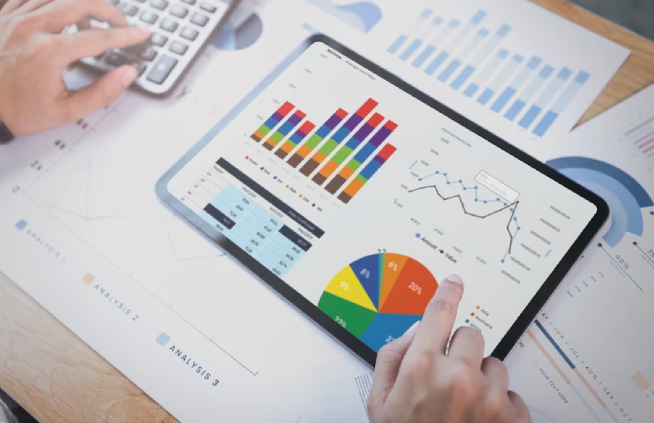
Service
Monitor your service performance, customer satisfaction, and resource utilization with dashboards

Google Analytics
Uncover actionable insights and improve online presence with powerful analytics dashboards

Marketing
Optimize production processes, reduce costs, and improve quality control with dashboards

Network and Hardware
Gain real-time visibility into network and hardware assets with interactive dashboards

Operations
Streamline processes and monitor performance with comprehensive operational dashboards

Customer Support
Enhance customer satisfaction and track support metrics with interactive support dashboards

Social Media Paids Ads
Optimize ad campaigns and track engagement with targeted social media dashboards


