
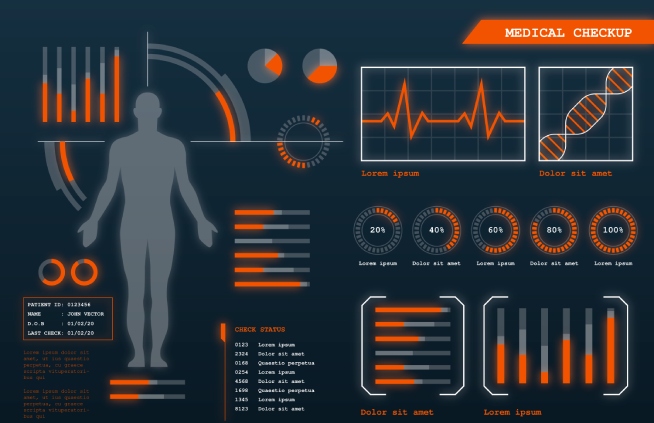
Health Care
Get real-time insights and enhance patient care with our healthcare dashboards
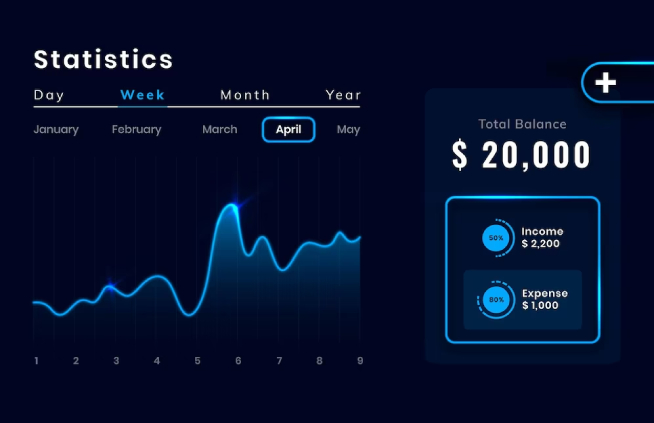
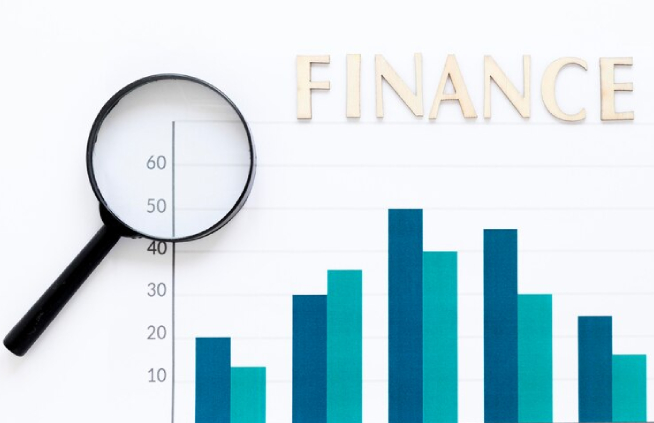
Finance / Banking
Monitor your financial performance and make informed decisions with our finance dashboards
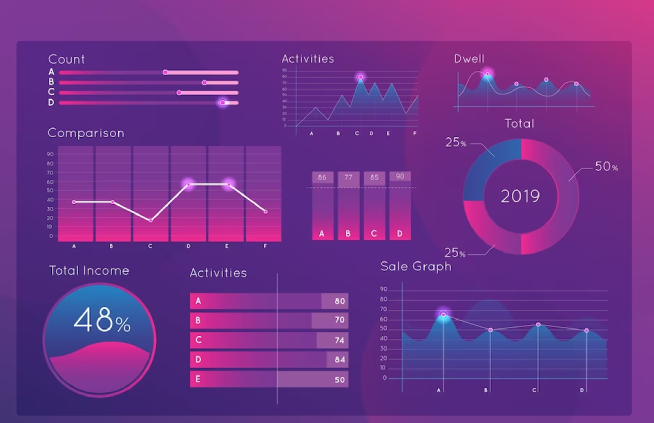
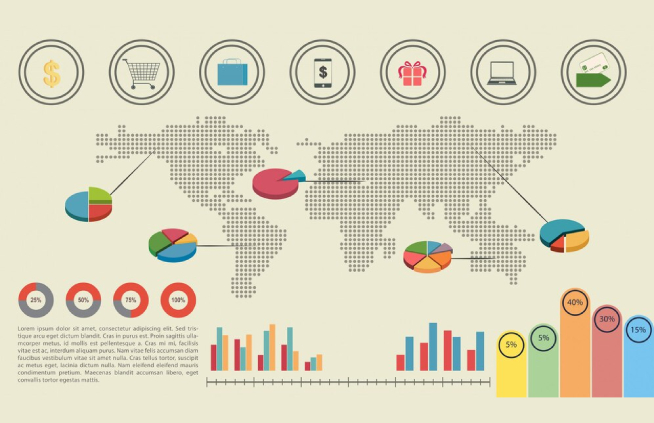
Sales
Optimize your sales strategy and drive revenue growth with our sales dashboards
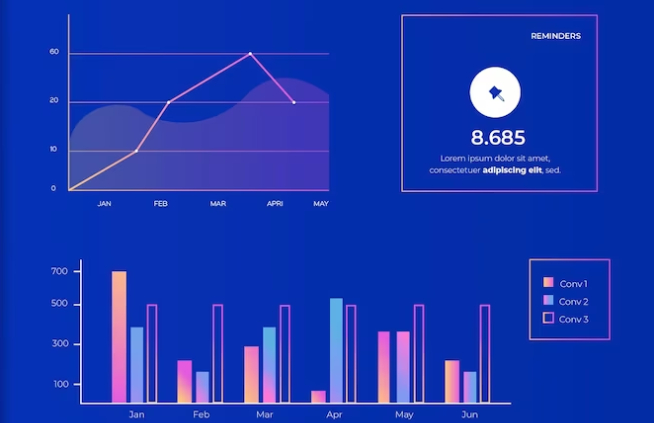
Manufacturing
Improve production efficiency and reduce costs with our manufacturing dashboards
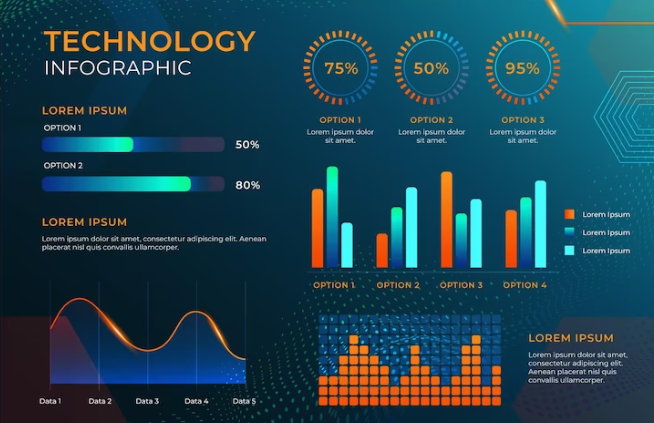
Information Technology
Transform your IT data into actionable insights with Tableau dashboards

Sales
Optimize your sales strategy and track your sales performance with Tableau dashboards
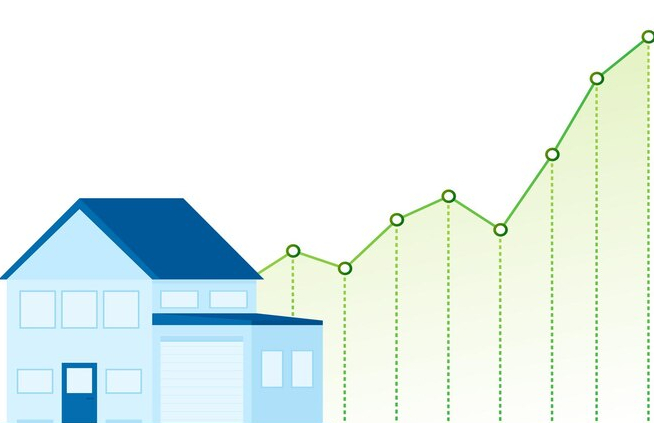
Real Estate
Analyze real estate data and trends to make informed investment decisions using Tableau dashboards
Retail
Track your sales performance, inventory levels, and customer behavior with Tableau dashboards
Finance
Monitor your financial performance and gain insights into your investments and portfolios with Tableau dashboards
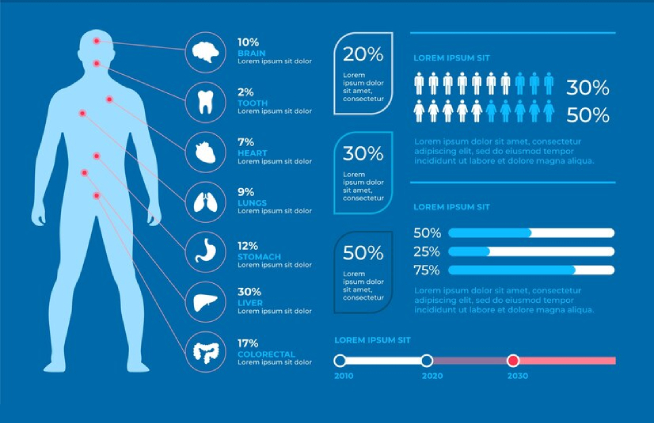
Healthcare
Improve patient outcomes, operational efficiency, and cost management with Tableau dashboards
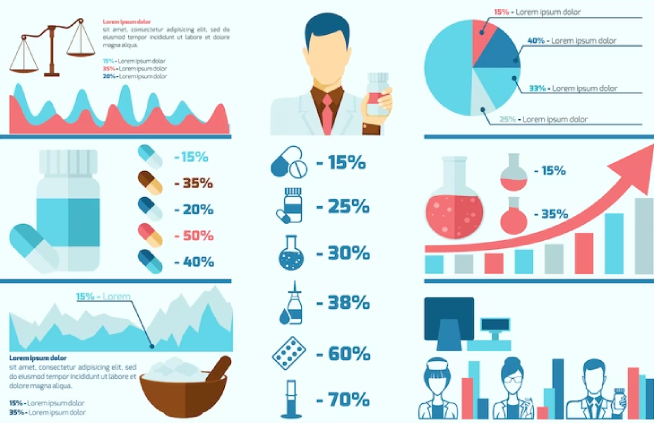
Pharmaceutical
Analyze drug performance, clinical trials, and sales data with Tableau dashboards

Service
Monitor your service performance, customer satisfaction, and resource utilization with Tableau dashboards
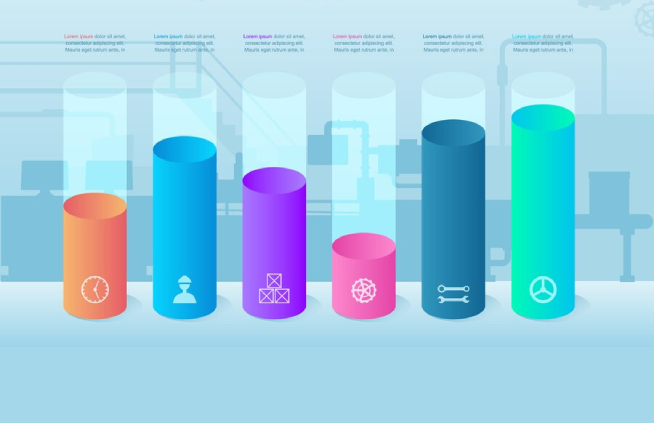
Manufacturing
Optimize production processes, reduce costs, and improve quality control with Tableau dashboards