Introduction:
In today’s data-driven world, businesses rely heavily on analyzing and interpreting vast amounts of information to make informed decisions. Microsoft Power BI has emerged as a powerful business intelligence tool that enables organizations to harness the potential of their data. In this blog, we will explore what Power BI is, its features, the concept of the Power BI dashboard, its advantages, and the key differences between dashboards and reports. We will also take a closer look at the features offered by Power BI Service. So, fasten your seatbelts and get ready to embark on an exciting journey into the realm of Power BI!
1. What is Power BI?
Power BI is a robust business analytics tool developed by Microsoft. It allows users to connect to various data sources, transform and visualize the data, and share insights across the organization. With Power BI, users can create interactive reports, dashboards, and visualizations, enabling them to gain valuable insights into their data quickly and effectively.
2. Features of Power BI
Data Connectivity: Power BI provides seamless connectivity to a wide range of data sources, including Excel, SQL Server, SharePoint, Dynamics 365, and more. This ensures that users can access and analyze data from multiple systems in a unified manner.
Data Transformation: Power BI allows users to perform data transformations, such as cleaning, shaping, and modeling, using an intuitive interface. It provides a powerful Query Editor that enables users to extract, transform, and load (ETL) data easily.
Interactive Visualizations: One of the key strengths of Power BI lies in its ability to create interactive visualizations. It offers a rich set of visual elements, including charts, graphs, maps, and tables, which can be customized to suit specific business needs. Users can leverage these visualizations to uncover patterns, trends, and outliers within their data.
Natural Language Queries: Power BI supports natural language queries, allowing users to ask questions about their data using plain English. The tool leverages artificial intelligence and machine learning algorithms to understand user queries and provide relevant visualizations and insights.
3. What is a Power BI Dashboard?
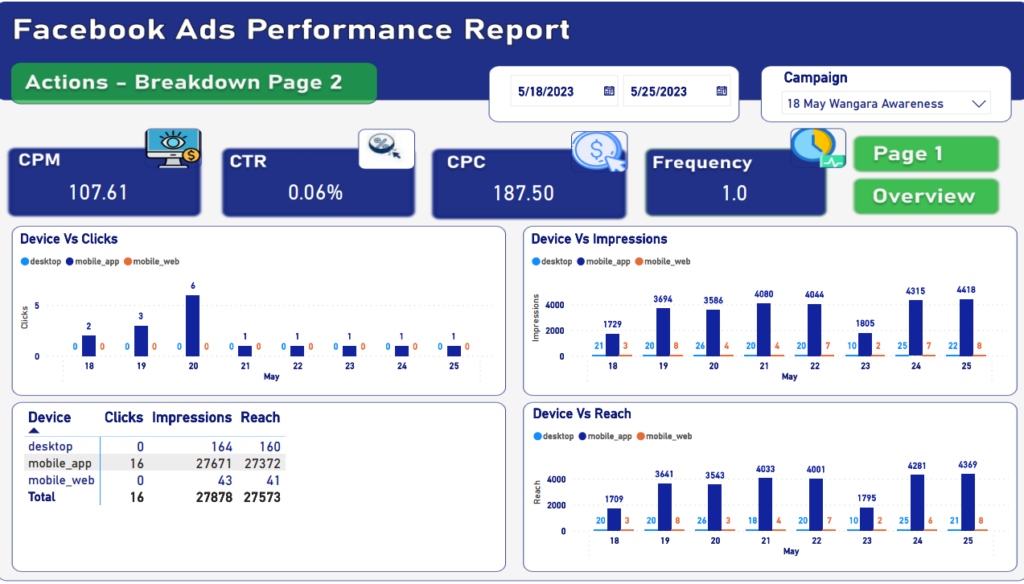
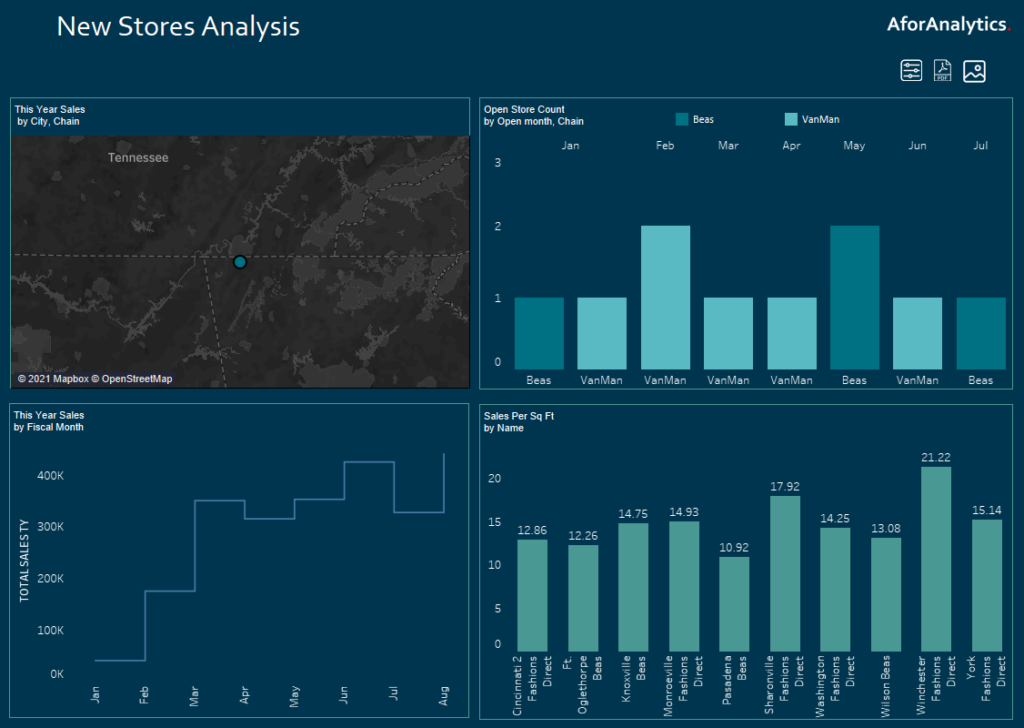
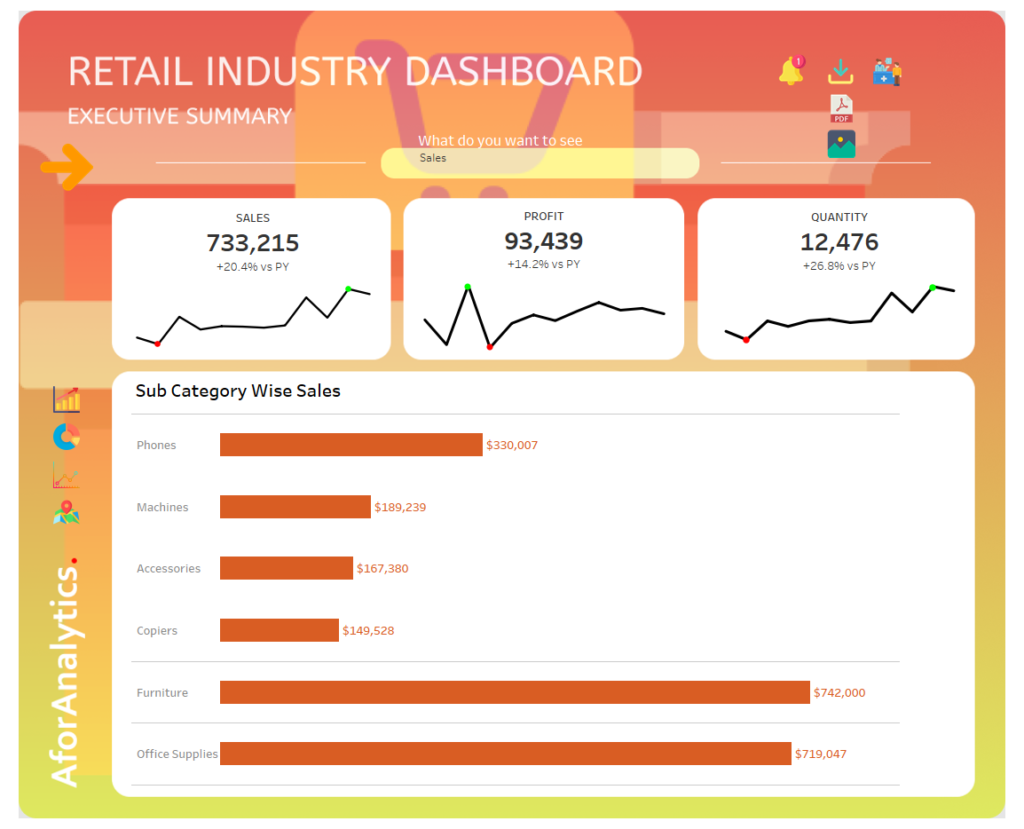
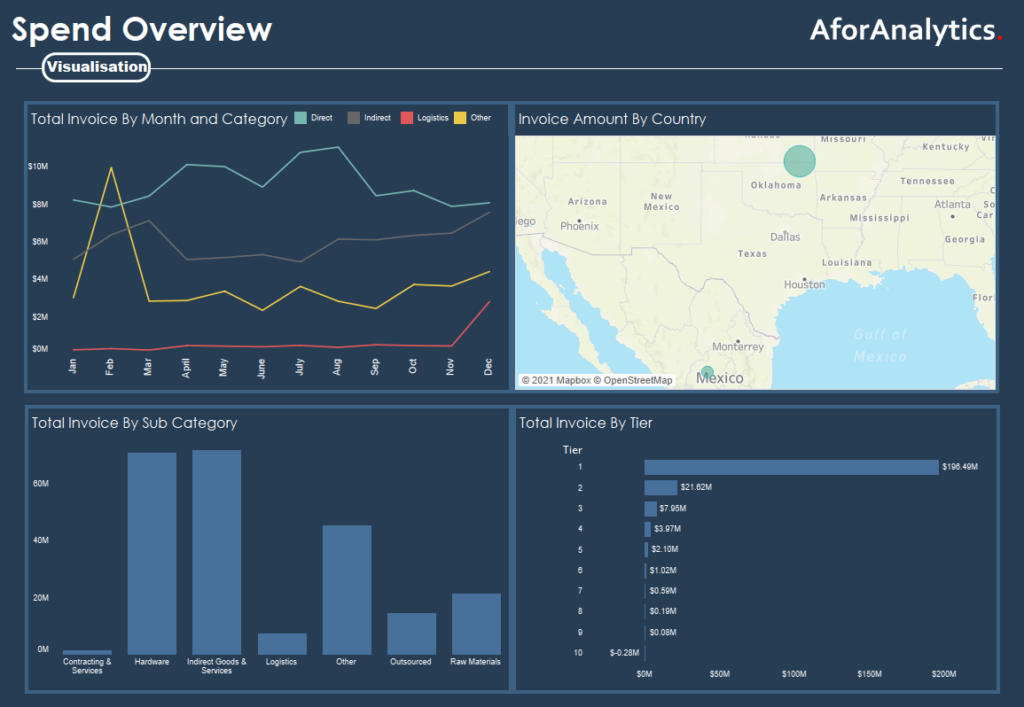
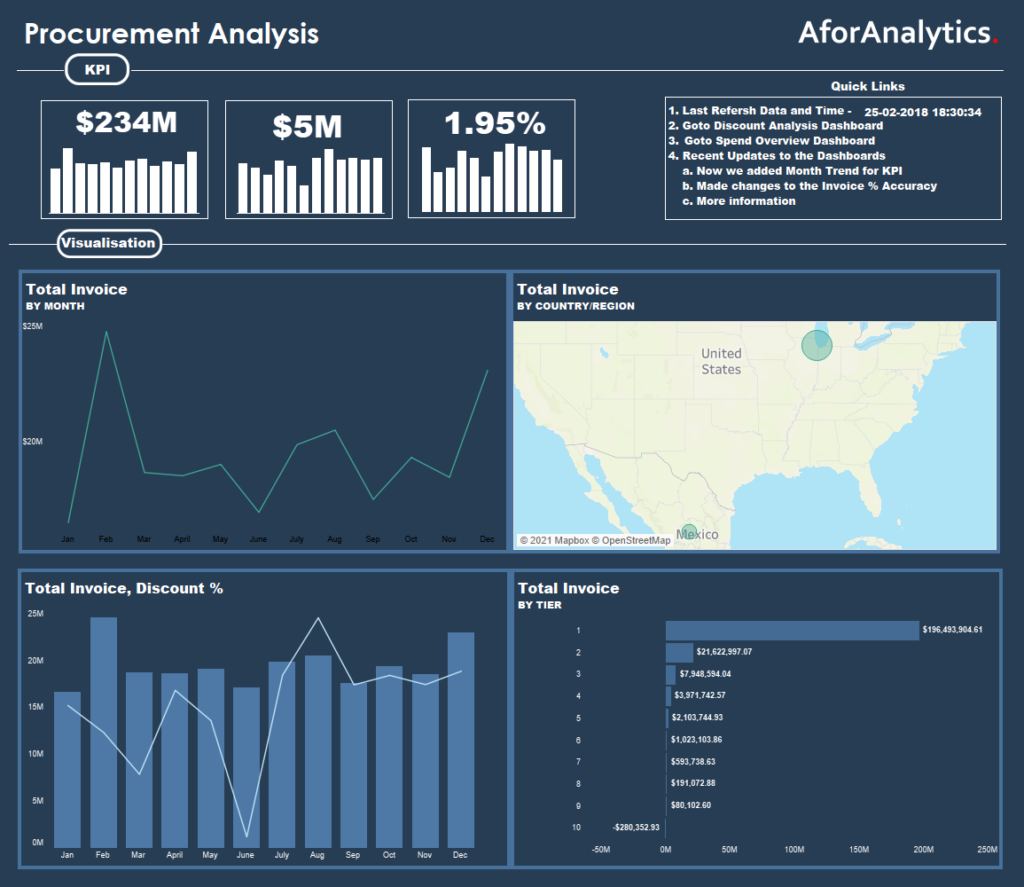
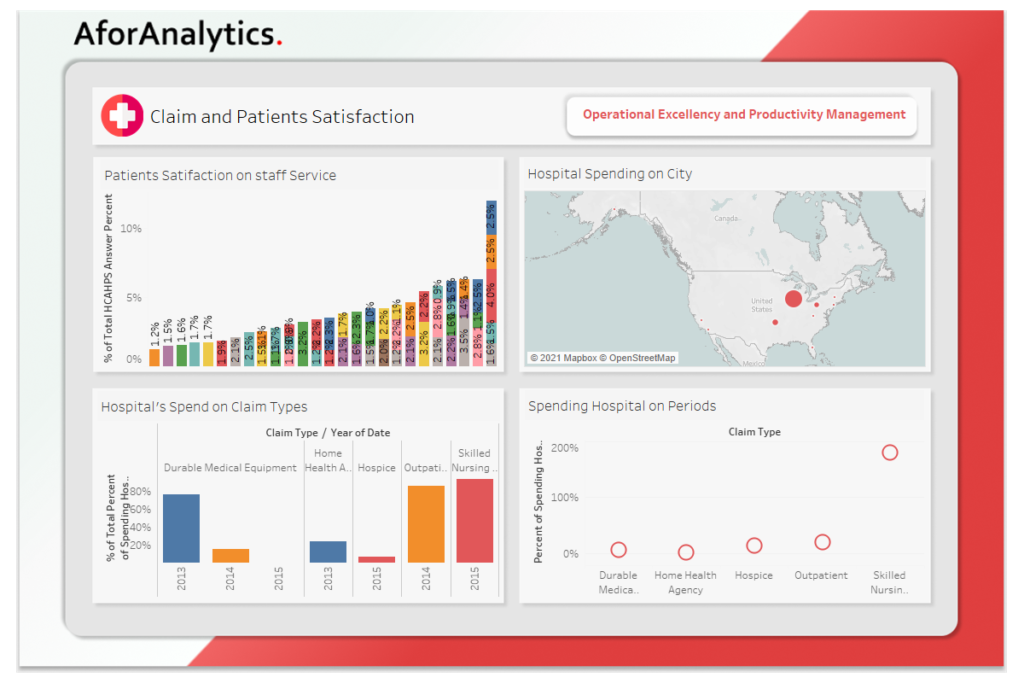
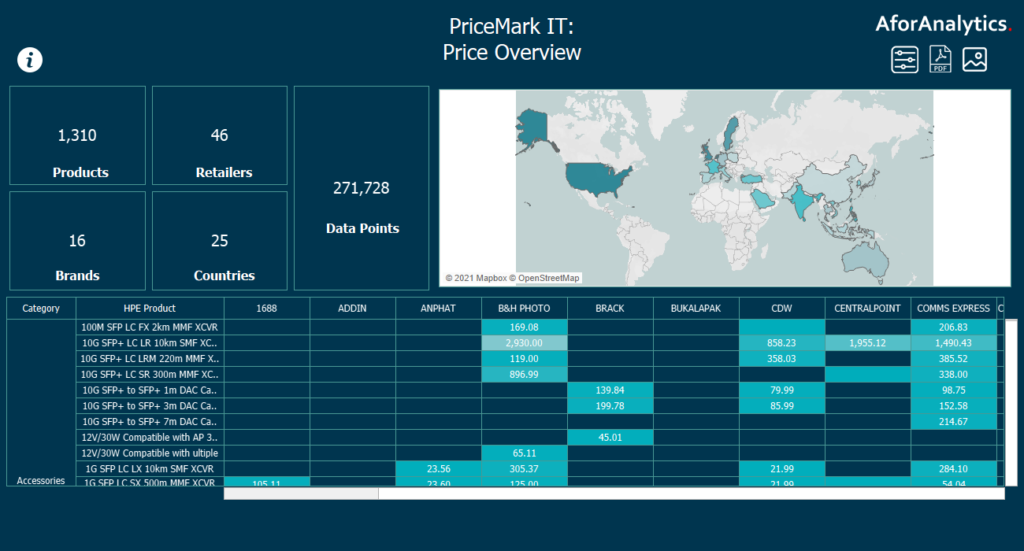
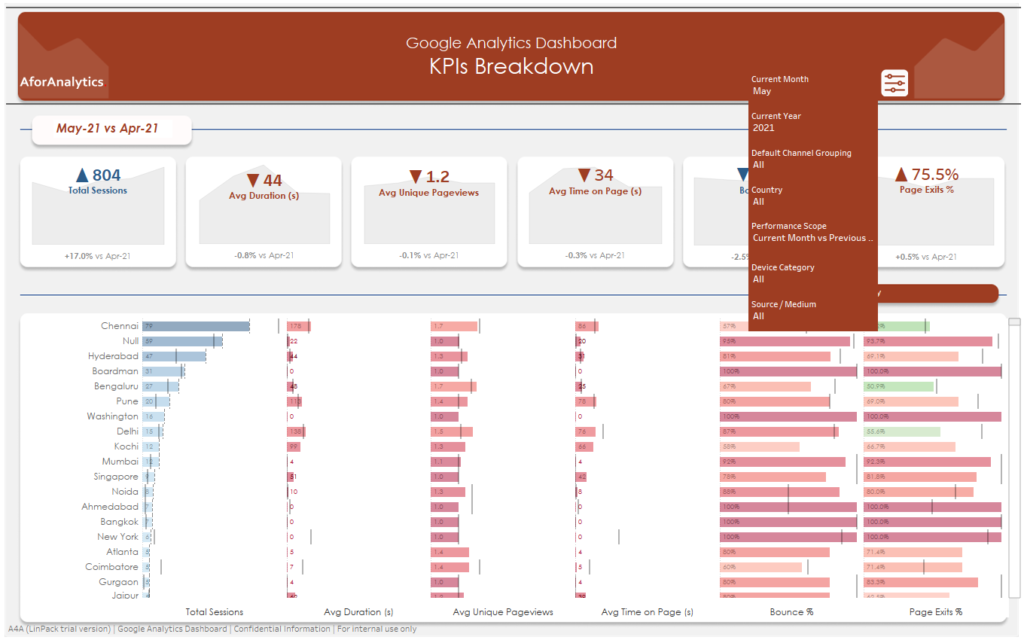
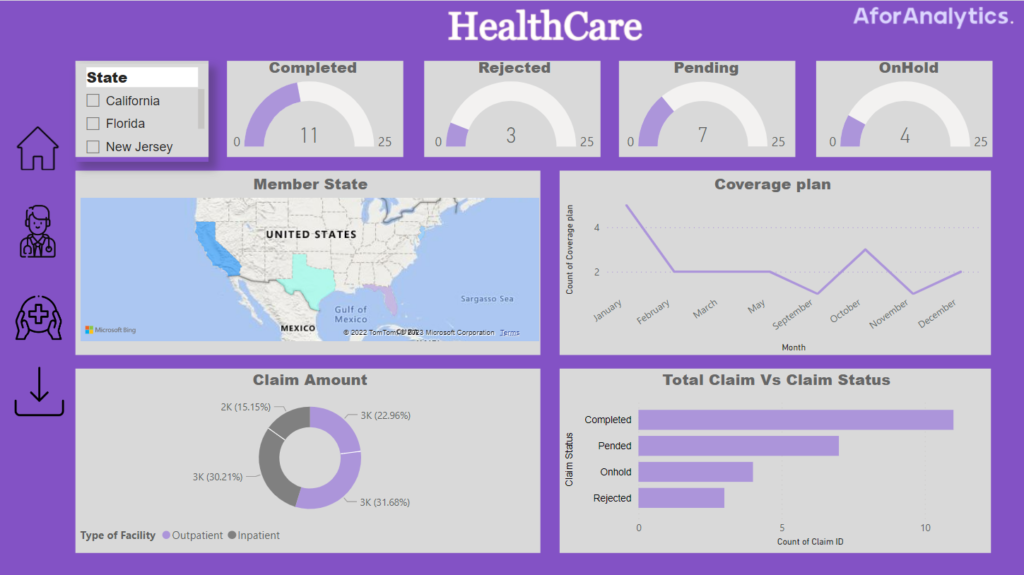
A Power BI dashboard is a collection of visualizations, reports, and key performance indicators (KPIs) that provide a consolidated view of business data. Dashboards are highly customizable and allow users to monitor the health of their business, track key metrics, and identify areas of concern at a glance. Power BI dashboards are interactive, enabling users to drill down into specific details and explore data in real-time.
4. Advantages of a Power BI Dashboard
Real-time Insights: Power BI dashboards provide real-time data updates, enabling users to stay informed about the latest trends and changes in their business. This empowers organizations to make timely decisions based on accurate and up-to-date information.
Interactive Data Exploration: With Power BI dashboards, users can interact with visualizations, filter data, and explore different perspectives effortlessly. This interactivity enhances the user experience and allows for deeper data analysis.
Collaboration and Sharing: Power BI dashboards can be securely shared with stakeholders, both within and outside the organization. This promotes collaboration, as teams can collaborate on data analysis, share insights, and make collective decisions.
5. Power BI Dashboards vs. Reports
While Power BI Dashboards and Reports both serve the purpose of data visualization, they have distinct characteristics and use cases:
Below is a comparison between Power BI Dashboards and Reports, focusing on various capabilities:
Capability | Dashboards | Reports |
Pages | Have only one page | Has one or more pages |
Data Sources | Contains one or more reports and one or more datasets per dashboard | Contains a single dataset per report |
Filtering | It can’t filter or slice the view | It can filter, highlight, and slice the view in various ways |
Availability on Power BI Desktop | Dashboards are not available in Power BI Desktop | Can create reports on Power BI Desktop |
Featured | You can set one dashboard as your “featured” dashboard | Cannot create a featured report |
In essence, dashboards are best for monitoring and staying informed at a glance, while reports are better suited for deeper analysis and comprehensive reporting.
6. Exploring the Features of Power BI Service
Power BI Service is a cloud-based platform that extends the capabilities of Power BI beyond the desktop application. It offers additional features and functionalities that enhance collaboration, data sharing, and data-driven decision-making.
Sharing and Collaboration: Power BI Service enables users to share dashboards, reports, and datasets with colleagues, clients, or stakeholders. It allows for real-time collaboration, ensuring that everyone has access to the latest information.
Data Refresh and Schedule: Power BI Service supports scheduled data refresh, ensuring that reports and dashboards always display the most recent data. Users can define refresh schedules to update data automatically at specified intervals.
Mobile Access: Power BI Service provides mobile applications for iOS and Android devices, enabling users to access their dashboards and reports on the go. This ensures that decision-makers have access to critical insights anytime, anywhere.
Conclusion
Power BI empowers organizations to make data-driven decisions by offering a comprehensive suite of business intelligence tools. From data connectivity and transformation to interactive visualizations and collaborative features, Power BI has revolutionized the way businesses analyze and share data. By leveraging the power of Power BI dashboards, organizations can gain valuable insights, monitor key metrics, and drive business growth. So, embrace the power of Power BI and unlock the true potential of your data today!