
Table of Contents
In 2011, Microsoft developed Power BI as a response to the growing demand for Business Intelligence (BI) tools. Its main purpose was to enhance Microsoft Excel’s existing capabilities by adding powerful analytical tools and creating interactive reports. Today, Microsoft Power BI is one of the leading BI tools in the market, as per Gartner’s Magic Quadrant. This has resulted in a high demand for Power BI professionals in the IT industry.
To help aspiring Power BI professionals, we have compiled a list of frequently asked questions (FAQs) based on three categories: Beginner Level, Intermediate Level, and Advanced Level. This tutorial will cover essential fundamentals of Power BI and help you crack interviews in real-time.
The most frequently asked Power BI interview questions include:
- What is Power BI?
- What is the difference between Power BI and Tableau?
- What is the difference between Power Query and Power Pivot?
- What is Power BI Desktop?
- What is Power Pivot?
- What is Power Query?
- What is DAX?
- What are Filters in Power BI?
- What are Custom Visuals in Power BI?
- What is GetData in Power BI?
We have compiled a total of 50 questions for you, ranging from beginner to advanced level. Let’s start by going through some of the most commonly asked beginner-level Power BI interview questions:
Power BI Interview Questions For Freshers
1. What is Power BI, and how is it used in business intelligence?
Power BI is a business intelligence tool developed by Microsoft that allows users to connect to different data sources, transform and analyze data, and create interactive visualizations and reports. It is used in business intelligence to help organizations make data-driven decisions by providing insights into their data.
2. What is Power Query, and how does it help in data preparation?
Power Query is a data transformation and data preparation tool in Power BI. It allows users to connect to different data sources, transform and clean data, and merge data from multiple sources. It helps in data preparation by providing a user-friendly interface for cleaning and shaping data, which saves time and reduces errors.
3. What is Power Pivot, and how is it used for data modeling?
Power Pivot is a data modeling tool in Power BI that allows users to create relationships between different data sources, define calculated columns and measures, and create hierarchies. It is used for data modeling to create a single data model that combines data from multiple sources and enables users to analyze and report on the data in a meaningful way.
4. What is DAX, and how is it used in Power BI?
DAX (Data Analysis Expressions) is a formula language used in Power BI to create custom calculations and measures. It is used to create complex calculations and aggregations based on data from different tables in a data model.
5. What is the difference between Power BI and Excel?
Power BI is a business intelligence tool that is designed for creating interactive visualizations and reports. It is used for data modeling, data transformation, and data visualization. Excel, on the other hand, is a spreadsheet program that is primarily used for calculations, data analysis, and reporting.
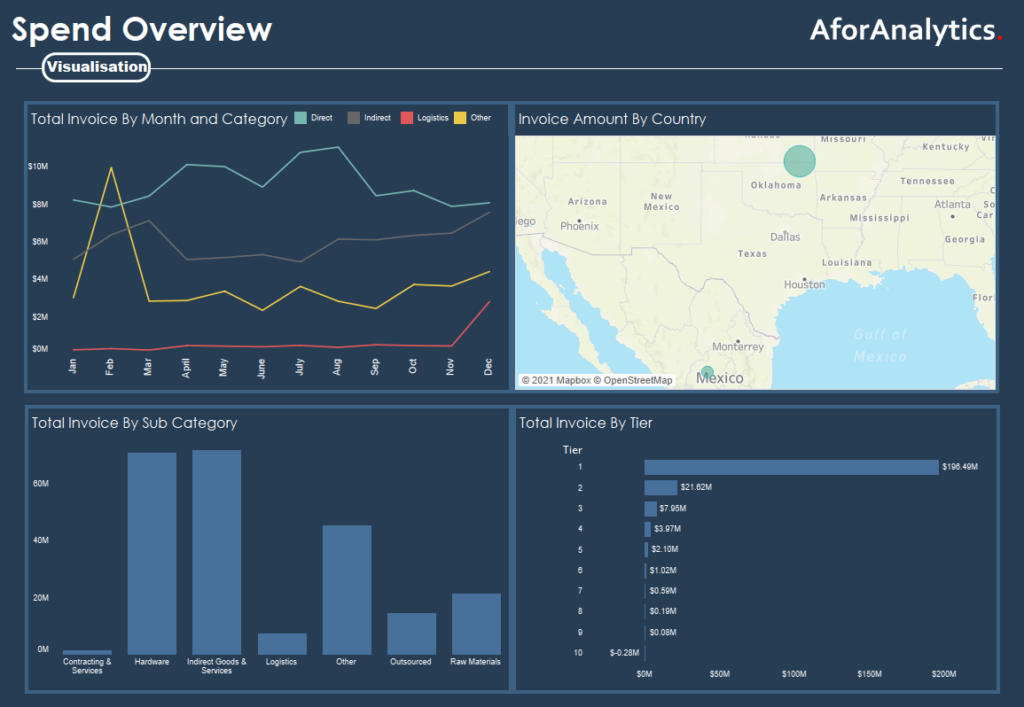
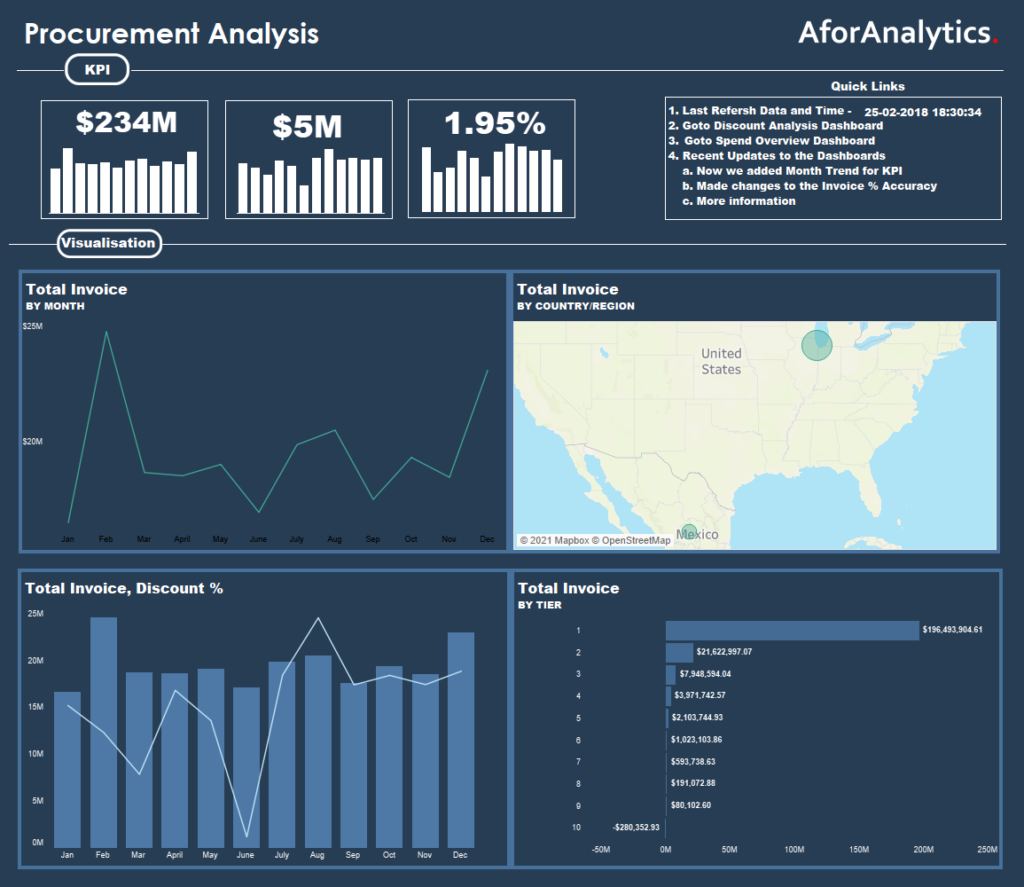
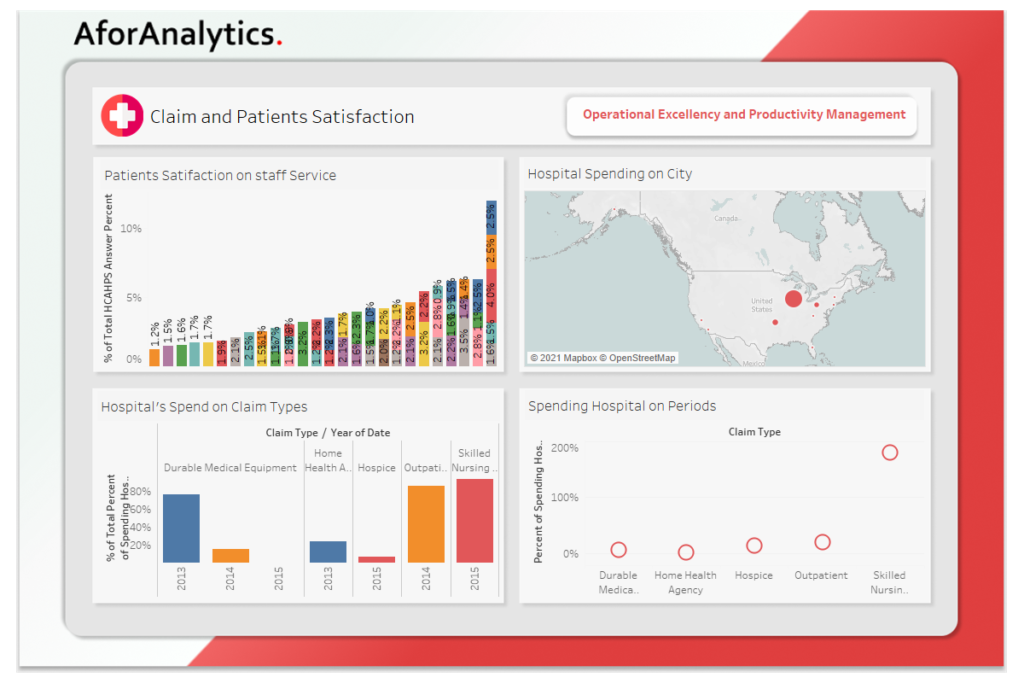
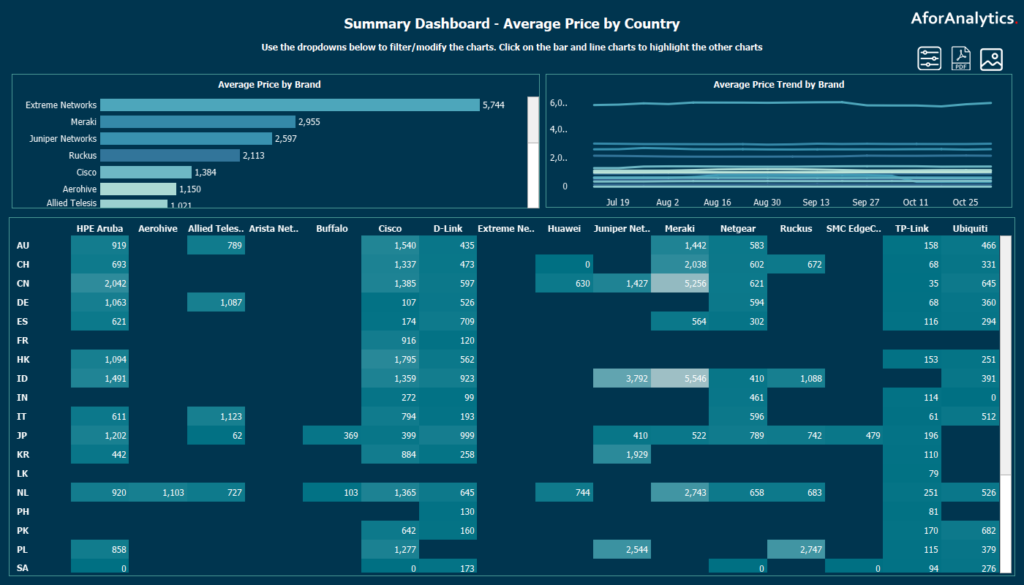
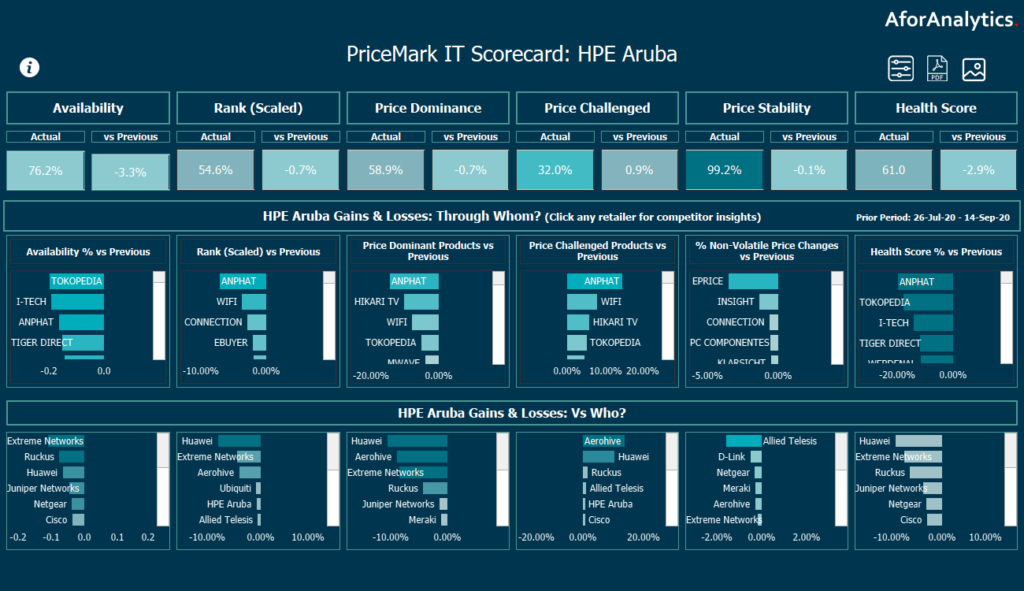
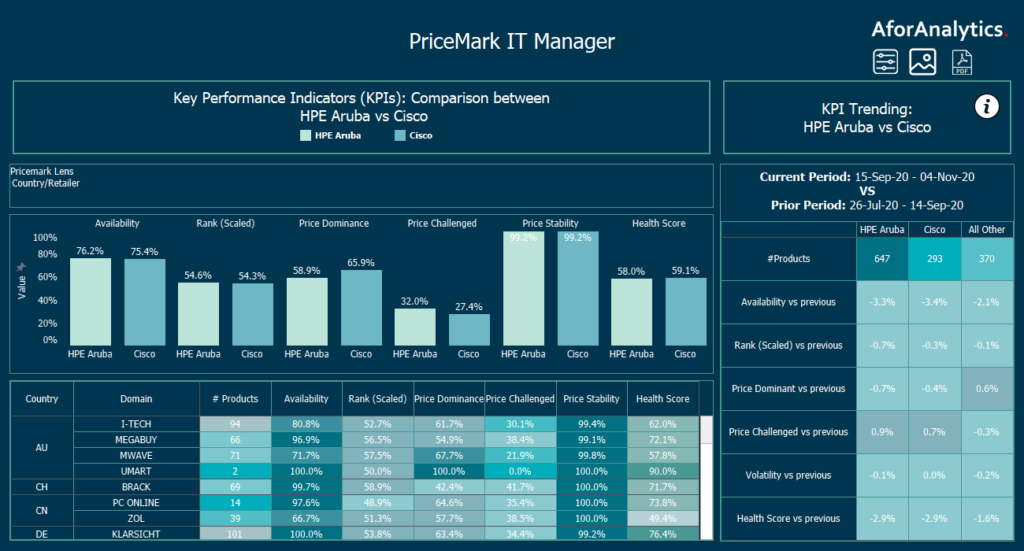
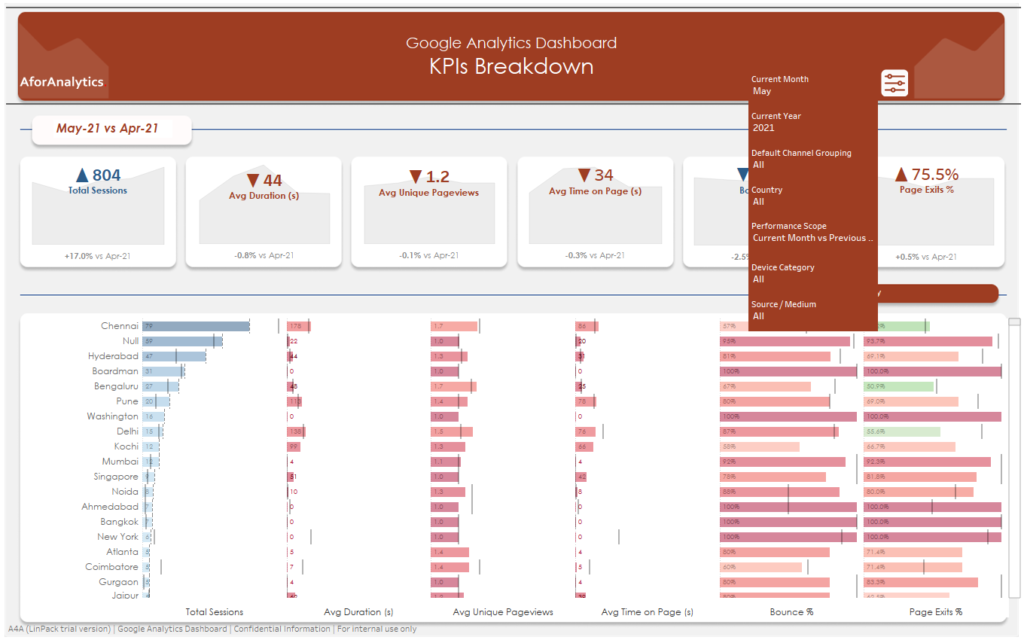
6. What are the different types of visualizations available in Power BI?
Power BI offers a wide range of visualizations, including bar charts, line charts, scatter plots, pie charts, maps, tables, matrices, gauges, cards, and more. These visualizations can be customized to fit the needs of the user and can be used to create interactive reports and dashboards.
7. What is a dashboard in Power BI, and how is it different from a report?
A dashboard in Power BI is a collection of visualizations that provide an overview of the key performance indicators (KPIs) for a particular business process or area. It is different from a report in that it is designed to provide a high-level view of the data, while a report is more detailed and provides more in-depth analysis of the data.
8. What is a data source in Power BI, and how do you connect to it?
A data source in Power BI is the location of the data that you want to analyze. Power BI allows you to connect to a variety of data sources, including Excel files, SQL Server databases, SharePoint lists, and more. To connect to a data source, you need to select the type of data source and provide the necessary connection information.
9. How do you create a calculated column in Power BI?
To create a calculated column in Power BI, you need to select the table in the data model and click on the “New column” button. Then, you can enter the formula for the calculated column using DAX syntax. Once the formula is entered, the calculated column will be added to the table in the data model.
10. How do you create a measure in Power BI?
To create a measure in Power BI, you need to select the table in the data model and click on the “New measure” button. Then, you can enter the formula for the measure using DAX syntax. Once the formula is entered
Power BI Interview Questions For Intermediate
11. What is the difference between Direct Query and Import mode in Power BI?
Direct Query mode allows Power BI to directly query the data source, providing real-time access to data without the need to import it into Power BI. Import mode, on the other hand, requires data to be imported into Power BI before it can be analyzed. Direct Query mode is ideal for larger data sets and real-time data, while Import mode is better suited for smaller data sets that do not require real-time analysis.
12. How do you optimize Power BI reports for performance?
To optimize Power BI reports for performance, you can take the following steps:
- Reduce the amount of data that needs to be loaded.
- Use filters and slicers to focus on specific subsets of data.
- Minimize the number of visuals on a single page.
- Use drill-through functionality to reduce the number of visuals needed.
- Use direct query mode for real-time data.
- Remove unnecessary columns from the data model.
13. How do you create a hierarchy in Power BI?
To create a hierarchy in Power BI, you can follow these steps:
- Select the column that you want to use as the top-level of the hierarchy.
- Right-click on the column and select “New Hierarchy”.
- Drag and drop the columns that you want to add to the hierarchy under the top-level column.
- Rename the hierarchy if necessary.
14. What is a drill-through in Power BI, and how is it used?
A drill-through in Power BI is a feature that allows users to navigate from one report or visual to another, typically for more detailed information. For example, users can click on a specific data point in a chart to drill-through to a more detailed report or visual that shows more information about that data point.
15. How do you create a dynamic title in Power BI?
To create a dynamic title in Power BI, you can use a DAX expression that references a measure or parameter. For example, you can create a measure that calculates a specific value and use that measure in the title. As the data changes, the title will update to reflect the new value.
16. How do you handle errors and missing data in Power BI?
To handle errors and missing data in Power BI, you can use various techniques such as:
- Use IFERROR function to handle errors and replace them with a default value.
- Use data modeling techniques such as handling null values and creating default values for missing data.
- Use conditional formatting to highlight missing data or errors.
17. How do you create a custom theme in Power BI?
To create a custom theme in Power BI, you can create a JSON file that defines the theme properties. The JSON file can be created manually or using a theme generator tool. Once the JSON file is created, it can be imported into Power BI and applied to the report or visual.
18. What is the difference between a slicer and a filter in Power BI?
A slicer is a visual control that allows users to filter data based on a specific field. A filter, on the other hand, is a data-level filter that applies to all visuals on a page or report. Slicers are used to filter data at the visual level, while filters are used to filter data at the data level.
19. How do you create a KPI in Power BI?
To create a KPI in Power BI, you can follow these steps:
- Create a measure that calculates the KPI value.
- Define the target value and thresholds for the KPI.
- Create a card visual and add the KPI measure to it.
- Add the target value and thresholds to the card visual.
20. How do you use the Power BI service to share reports with others?
To share reports with others in Power BI service, you can publish your report to the Power BI service and share it with others by providing them with the report URL or embedding the report into a website or SharePoint. You can also use the share button to share a report with specific individuals or groups within your organization, and you can set permissions to control who can view or edit the report. Additionally, you can export the report to various formats, such as PDF or PowerPoint, for offline viewing or sharing.
Power BI Interview Questions for Experienced
21. What is a data model in Power BI, and how do you create one?
A data model is a representation of data in a structured format in Power BI. It defines the relationships between tables, columns, and measures used in reports and dashboards. You can create a data model in Power BI by importing data from different sources, transforming it as required, and defining relationships between tables using the diagram view.
22. What is the difference between a calculated column and a measure in Power BI?
A calculated column is a column that you create in a table by defining a formula based on other columns in the same table. It is used to add new data to a table. On the other hand, a measure is a calculation that you create based on a column or columns in one or more tables. It is used to perform mathematical or statistical calculations, such as sum, average, or count, and is displayed in a visual or a table.
23. How do you create a custom visual in Power BI?
You can create a custom visual in Power BI using the Power BI Developer Tools. You need to have a good understanding of JavaScript, TypeScript, and the Power BI API to create a custom visual. The process involves creating a new visual project, coding the visual using the provided APIs, and then packaging and deploying the visual.
24. What is a Power BI gateway, and how does it work?
A Power BI gateway is a software component that enables Power BI to access on-premises data sources, such as SQL Server or Oracle databases. It acts as a bridge between Power BI in the cloud and your on-premises data sources. The gateway is installed on a computer that is located on your organization’s network and is used to manage and secure the connection between Power BI and your on-premises data sources.
25. How do you create a Power BI template?
To create a Power BI template, you need to create a report or a dashboard in Power BI Desktop and then save it as a template file. The template file can be reused by other users to create new reports or dashboards with the same design and layout. To create a template, go to the Home tab in Power BI Desktop, select Save As, and then choose Power BI Template (*.pbit) as the file type.
26. What is a Power BI embedded report, and how does it work?
A Power BI embedded report is a report that is embedded in a web application or a custom application using the Power BI Embedded API. It allows users to view and interact with Power BI reports without leaving the application. To create an embedded report, you need to create a report in Power BI Desktop, publish it to the Power BI service, and then embed it in your web or custom application using the Power BI Embedded API.
27. How do you create a custom connector in Power BI?
To create a custom connector in Power BI, you need to use the Power Query SDK, which is a set of tools and APIs that allows you to build connectors for various data sources. The process involves creating a new connector project, defining the connection details and the metadata for the data source, and then implementing the required functions to access and retrieve the data.
28. What is a Power BI API, and how is it used?
The Power BI API is a set of REST APIs that allows developers to programmatically access and manipulate Power BI artifacts, such as reports, dashboards, and datasets. The API can be used to automate tasks, integrate Power BI with other applications, and create custom solutions.
29. How do you use Power BI with R or Python?
Power BI supports the integration of R and Python scripts to enhance data analysis and visualization. To use R or Python with Power BI, you need to install the required libraries and connect to the script from Power BI. You can use the R or Python script as a data source, transform data with code, or generate custom visuals.
30. What is a Power BI paginated report, and how does it differ from other report types?
A Power BI paginated report is a type of report that is optimized for printing or generating PDFs. Unlike other report types in Power BI, paginated reports provide pixel-perfect layout and formatting, support for table-of-contents and bookmarks, and the ability to embed reports in other applications. Paginated reports are created using SQL Server Reporting Services (SSRS), which is integrated with Power BI.
Data Modeling Using Power BI Interview Questions
31. What is a dimension table, and how is it used in data modeling?
A dimension table is a table that contains descriptive attributes used to filter, group, or sort data in a data model. It is used in data modeling to provide context and meaning to the measures in a fact table. Examples of dimension tables include a customer table, product table, or location table.
32. What is a fact table, and how is it used in data modeling?
A fact table is a table that contains numeric and additive data that can be aggregated or measured. It is used in data modeling to store the metrics or measurements of the business process being analyzed. Examples of fact tables include a sales table, inventory table, or financial table.
33. What is a star schema, and how is it used in data modeling?
A star schema is a type of data modeling where one or more dimension tables are related to a fact table in a one-to-many relationship. It is called a star schema because the diagram resembles a star, with the fact table at the center and the dimension tables radiating outwards. It is used in data modeling to simplify queries and improve performance by reducing the number of joins required to retrieve data.
34. What is a snowflake schema, and how is it used in data modeling?
A snowflake schema is a type of data modeling where one or more dimension tables are normalized into multiple related tables, creating a hierarchy of tables. It is called a snowflake schema because the diagram resembles a snowflake, with the fact table at the center and the dimension tables branching outwards in a snowflake pattern. It is used in data modeling to reduce data redundancy and improve data quality.
35. How do you create a relationship between tables in Power BI?
To create a relationship between tables in Power BI, you need to select the two tables you want to relate and choose the column in each table that will be used as the basis for the relationship. Then, you need to specify the cardinality of the relationship (e.g. one-to-one, one-to-many, many-to-one, or many-to-many) and the cross filter direction (e.g. single, both, or automatic).
36. What is a one-to-many relationship, and how is it used in data modeling?
A one-to-many relationship is a type of relationship where each record in one table can have multiple related records in another table, but each record in the related table can only have one record in the original table. It is used in data modeling to represent hierarchies or parent-child relationships between data.
37. What is a many-to-many relationship, and how is it used in data modeling?
A many-to-many relationship is a type of relationship where each record in one table can have multiple related records in another table, and each record in the related table can also have multiple related records in the original table. It is used in data modeling to represent complex relationships between data that cannot be represented with a one-to-many relationship.
38. What is a bridge table, and how is it used in data modeling?
A bridge table is a table used to resolve a many-to-many relationship between two other tables. It contains the foreign keys from both tables and is used to create a one-to-many relationship between the two tables.
39. What is a calculated table, and how is it used in data modeling?
A calculated table is a table that is created by applying a formula or expression to an existing table in a data model. It is used in data modeling to simplify queries or create new dimensions that are not present in the original data.
40. What is a date table, and how is it used in data modeling?
A date table is a table that contains a list of dates and other date-related information, such as day
Power Query for Power BI Interview Questions
41. What is a query editor in Power Query, and how is it used?
Query Editor in Power Query is a data transformation and cleaning tool that is used to extract, transform and load data. It is used to edit queries, which are step-by-step instructions for importing, cleaning and transforming data from various sources. The Query Editor provides a user-friendly interface to perform data transformations on your data.
42. How do you remove duplicates in Power Query?
To remove duplicates in Power Query, select the column or columns that contain duplicates, then go to the Home tab, click on Remove Rows, and then click on Remove Duplicates.
43. How do you merge or append queries in Power Query?
To merge or append queries in Power Query, go to the Home tab and click on Merge Queries or Append Queries. You will then need to select the queries you want to merge or append, and then choose the type of merge you want to perform.
44. How do you filter rows in Power Query?
To filter rows in Power Query, select the column or columns that you want to filter on, then go to the Home tab, click on the Filter Rows dropdown menu, and select the filter criteria you want to apply.
45. How do you split columns in Power Query?
To split columns in Power Query, select the column or columns that you want to split, then go to the Home tab, click on Split Columns, and then choose the delimiter you want to use to split the columns.
DAX for Power BI Interview Questions
46. What is a DAX formula, and how is it used in Power BI?
DAX stands for Data Analysis Expressions and is a formula language used in Power BI. It is used to create custom calculations and aggregations based on the data model in Power BI. DAX formulas are used to create measures, which are calculations that can be used in visualizations and reports.
47. What are calculated columns, and how
Calculated columns in Power BI are columns that are created using DAX formulas. They are used to perform custom calculations on data that is already in the data model. Calculated columns are different from measures in that they are calculated during the data import process, while measures are calculated at query time. Calculated columns are useful for creating new columns based on existing data or for adding calculated columns to a table.
48. What is a drill-through report in Power BI, and how does it differ from a drill-down report?
drill-through report in Power BI is a report that provides additional details for a specific data point. It allows users to access more detailed information by clicking on a specific data point in a visual, which opens up a new report with additional details. On the other hand, a drill-down report allows users to navigate from a higher-level summary to a lower-level detail view of the data.
49. What is a bookmark in Power BI, and how can it be used?
A bookmark in Power BI is a feature that allows users to save the state of a report page, including filters, selections, and other settings. It can be used to create a custom navigation experience for the users or to allow them to compare different versions of the same report. For example, you can create a bookmark for a specific view of a report and then use that bookmark to return to that view later.
50. How can you optimize the performance of a Power BI report?
There are several ways to optimize the performance of a Power BI report, such as reducing the amount of data being loaded, using summarized data instead of detailed data, optimizing DAX formulas, using filters and slicers to reduce the amount of data being displayed, and minimizing the use of custom visuals. Additionally, you can consider optimizing the data source and ensuring that it is properly indexed and optimized for performance.
In conclusion, we have covered the top 50 Power BI interview questions for beginners, intermediate, and advanced levels. These questions will help you prepare for your next Power BI job interview and showcase your knowledge and expertise in this popular business intelligence tool. By understanding these concepts and mastering them, you can demonstrate your proficiency in Power BI and secure your dream job in the field of business intelligence. Keep practicing and stay up-to-date with the latest Power BI developments to enhance your skills and advance your career. Good luck!


good blog
power bi services in Hyderabad
Very helpful tips!! Thank you for this great post.
RR Technosoft is the best azure devopsTraining institute in Hyderabad and it provides Class room & Online Training by real time faculty with course material and Lab Facility.
Yes its true a good quality content
Big data hadoop training in Hyderabad.Instaskill Training Institute provides a big data course in Hyderabad Kondapur,by real-time faculty.