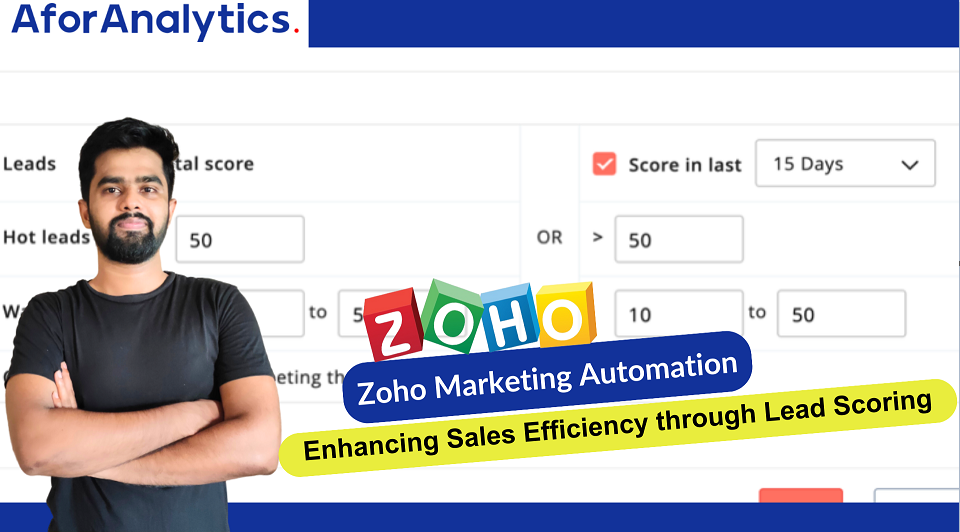
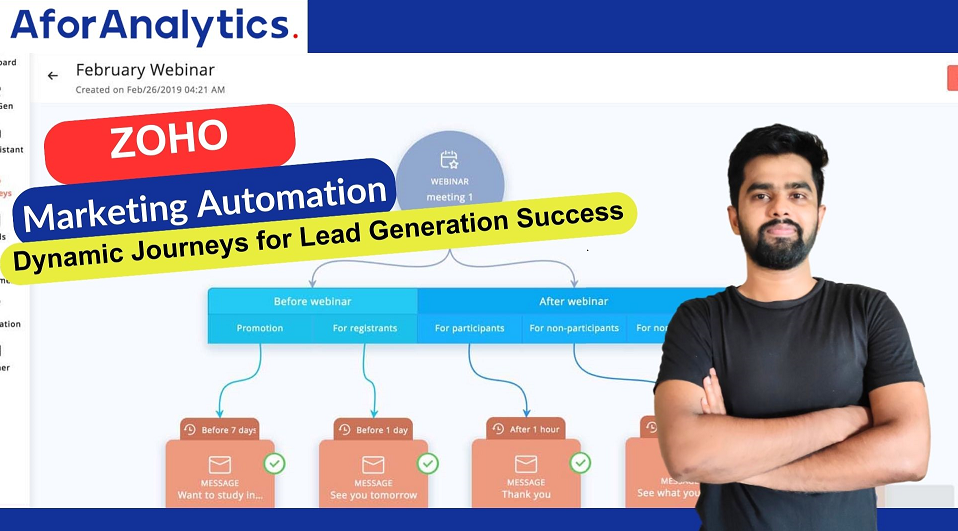
Streamline Your Sales and Marketing Efforts with Zoho CRM Integration
In today’s competitive business landscape, the synergy between sales and marketing is paramount for success. By seamlessly integrating Zoho Marketing Automation with Zoho CRM, businesses can harness the power of email marketing, campaign management, and lead generation to drive growth and enhance customer engagement. Let’s explore how this integration can revolutionize your approach to sales […]
Streamline Your Sales and Marketing Efforts with Zoho CRM Integration Read More »