One of the fundamental concepts in Tableau is the differentiation between discrete and continuous fields. These fields play a crucial role in shaping the way data is visualized and interpreted in Tableau. In this article, we will delve into the world of discrete and continuous fields, exploring their differences, use cases, and best practices for effective data visualization.
Understanding Discrete Fields & Continuous Fields
Discrete fields in Tableau are typically used to represent categorical or distinct data points. When you place a discrete field on a shelf in Tableau, it creates headers or labels for each unique value within that field. These headers are often displayed as discrete pills in the view. Discrete fields are, in essence, used for data that can be counted or categorized.
On the other hand, continuous fields are used to represent data that falls along a continuous scale. When you place a continuous field on a shelf in Tableau, it typically results in a continuous axis, such as a number line. Continuous fields are ideal for numerical data that can be measured with precision.
Example
Green Color Fields and Blue Color Fields
Blue Colour Fields are discrete Tableau fields that hold categories or separate values, like different categories or groups. For example, if we have a dataset containing a column representing various fruits, such as apples, oranges, and bananas. We can consider this column a Blue Colour Field in Tableau.
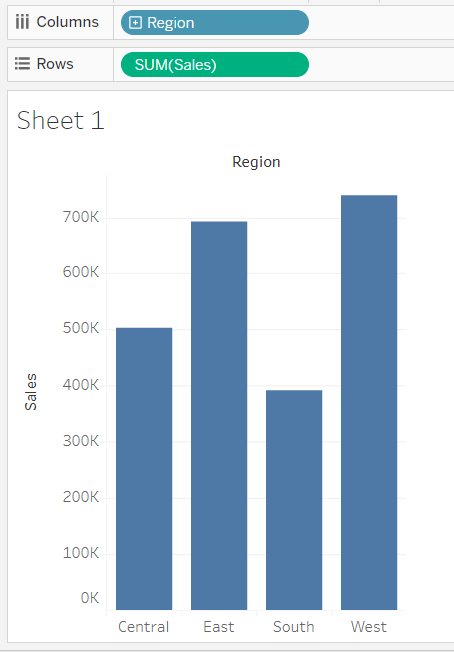
The Region field in this example is set to Discrete. Instead of an axis, horizontal headers are produced. The horizontal headers and blue background make it easier to see that it’s discrete.
In Tableau, Green Color Fields are the continuous fields. Continuous fields are fields such as temperature, time, and sales revenue. These often reflect numerical or quantitative data that can be monitored on a continuous scale. This enables the visualization of data’s progressive changes and patterns. It allows us to have deeper insights and analysis of data.
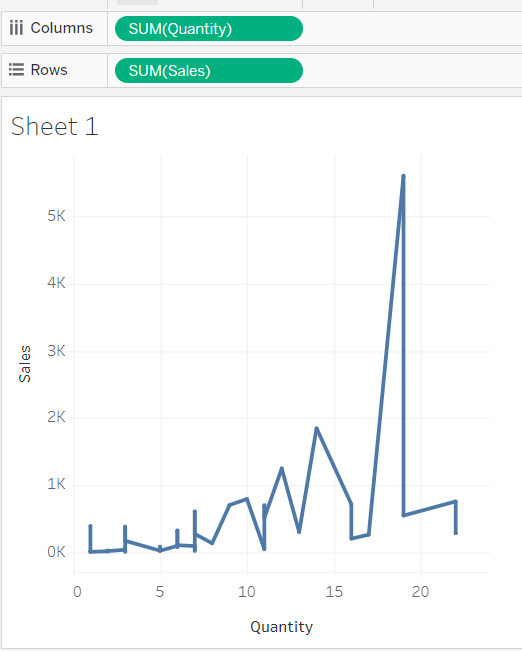
In this example, the Quantity field is set to Continuous. Then a horizontal axis appears at the bottom of the on view. You can see that it’s a continuous field because of the green background and axis.
Alright!! Now let us dive into the features of discrete fields and continuous fields.
Scenarios where discrete fields are applicable:
Categorical Data: When you have data that falls into distinct categories or groups, such as product names, regions, or customer segments, discrete fields are the way to go. They allow you to create separate columns or rows for each category.
Grouping Data: Discrete fields are also essential for creating groups or sets. You can use them to define custom groupings of data for more granular analysis.
Bar Charts: Discrete fields are often used in bar charts, where each category is represented as a separate bar.
Scenarios where continuous fields are appropriate:
Numerical Data: If you’re dealing with measurements like sales revenue, temperature, or time, continuous fields are the right choice. They allow for precise representation and calculations.
Line Charts: Continuous fields are commonly used in line charts, where data points are connected by lines to show trends or changes over time.
Scatter Plots: Scatter plots are a classic example of using continuous fields to visualize the relationship between two numerical variables.
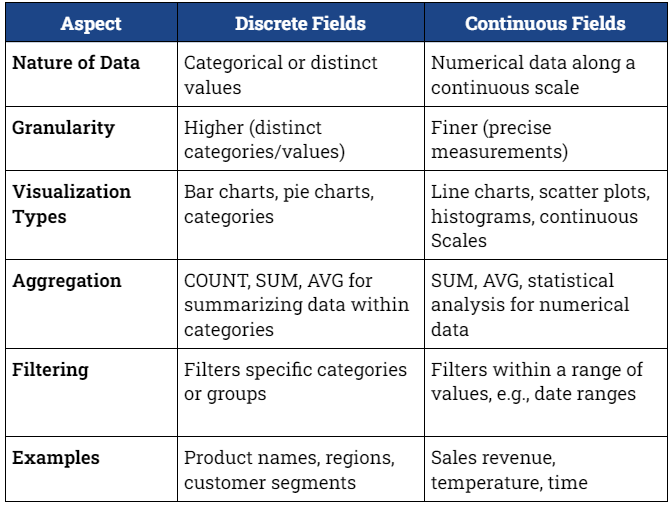
Discrete vs. Continuous Fields in Tableau
Conclusion
In Tableau, the choice between discrete and continuous fields is a critical decision that shapes your data visualization and analysis. Understanding the nature of your data and the requirements of your analysis will guide you in making the right choice. By mastering the use of discrete and continuous fields and following best practices, you can create compelling visualizations that unlock valuable insights from your data.
As a company dedicated to Tableau consulting, “A for Analytics,” we recognize the significance of these distinctions in helping our clients harness the full potential of their data. Whether it’s exploring categorical data or analyzing numerical trends, Tableau provides the tools you need to tell your data’s story effectively. Our team of experts stands ready to assist you in navigating these choices and making the most of Tableau’s capabilities to drive informed decisions and transformative insights.