Full-Time Equivalent (FTE) is a crucial metric used in many organizations to determine the number of full-time employees working in a particular department or project. Calculating FTE can be a complex process, especially when dealing with multiple departments or projects. Fortunately, Power BI provides a powerful toolset for FTE calculations, allowing organizations to streamline their workforce management processes and make more informed decisions. In this blog, we will explore the basics of FTE calculation using Power BI and the various techniques that can be employed to perform more advanced FTE calculations.
What is Full-Time Equivalent (FTE)?
FTE is a metric that is commonly used by organizations to measure the workload of their employees. FTE is a calculation that determines the total number of hours worked by a group of employees, compared to the number of hours that would be worked by a single full-time employee in the same period. For example, if a group of part-time employees works a total of 80 hours in a week, the Full-Time Equivalent would be calculated as 2 (80/40). This means that the work performed by these employees is equivalent to the work that would be performed by two full-time employees.
Basic Full Time Equivalent Calculation in Power BI
Power BI provides several tools that make FTE calculations easier. The most basic FTE calculation is to divide the total number of hours worked by the employees by the number of hours worked by a full-time employee in the same period. To create a basic FTE calculation in Power BI, follow these steps:
- Open Power BI and select the data source that contains the employee data.
- Create a new measure by clicking on the “New Measure” button.
- Enter a name for the measure, such as “FTE Calculation.”
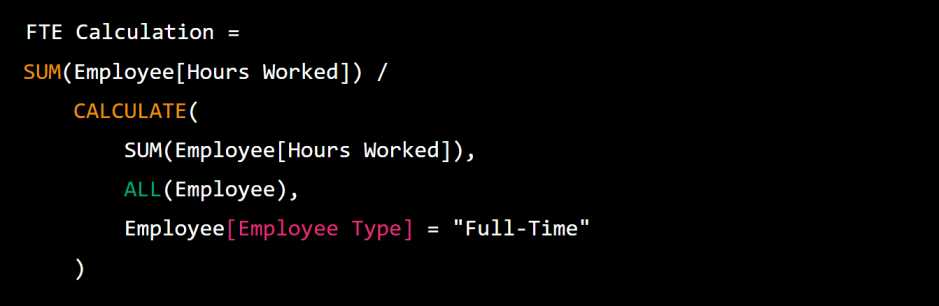
- In the formula bar, enter the following formula:
FTE Calculation = SUM(Employee[Hours Worked]) / 40
Here, we assume that a full-time employee works 40 hours per week.
- Click on “OK” to create the measure.
This measure will now be available for use in any visualizations that you create in Power BI. For example, you can create a table that displays the FTE calculation for each department or project.
Advanced Full Time Equivalent Calculations in Power BI
While the basic FTE calculation can be useful for simple scenarios, more complex FTE calculations may require additional techniques. Power BI provides several tools that can be used to perform more advanced FTE calculations.
- Hierarchies: Power BI allows you to create hierarchies, which can be used to group data by different levels. For example, you can create a hierarchy that groups employees by department and then by project. This can be useful for calculating FTE at different levels of granularity.
- Slicers: Slicers are visualizations that allow you to filter data based on specific criteria. For example, you can create a slicer that allows you to filter data by department or project. This can be useful for calculating FTE for specific departments or projects.
- Calculated Columns: Power BI allows you to create calculated columns, which are columns that are based on calculations performed on other columns in the dataset. Calculated columns can be useful for performing more complex FTE calculations, such as calculating FTE for part-time employees who work irregular hours.
- DAX Functions: Data Analysis Expressions (DAX) is a formula language used in Power BI to create custom calculations. DAX functions can be used to perform more advanced FTE calculations, such as calculating FTE based on employee roles or calculating FTE for employees who work different shifts.
Best Practices for FTE Calculations with Power BI
When creating FTE calculations in Power BI, it is important to follow best practices to ensure accuracy and consistency. Some best practices to consider include:
- Consistent Data: Ensure that your data is consistent and accurate. Inaccurate data can lead to incorrect FTE calculations, which can have negative impacts on workforce management decisions.
- Standardize Hours: Standardize the number of hours worked by a full-time employee in your organization. This will ensure that all FTE calculations are consistent and can be compared across different departments and projects.
- Regular Updates: Ensure that FTE calculations are updated regularly. This will ensure that your workforce management decisions are based on up-to-date information.
- Test and Validate: Test your FTE calculations and validate the results. This will help to ensure that your calculations are accurate and reliable.
- Document Your Process: Document your FTE calculation process to ensure that it can be easily replicated and understood by others in your organization.
Creating Revenue Tiers and FTE Calculations with Power BI: A Step-by-Step Guide
Step 1: Connect to the Data Source
- The first step in creating a report in Power BI is to connect to the data source. In this example, let’s assume that we have a dataset that contains revenue and FTE data for a company. We will connect to this dataset using Power BI Desktop.
- To connect to the dataset, open Power BI Desktop and click on “Get Data” in the Home tab. Select the appropriate data source and enter the required credentials. Once connected, the data will be displayed in the “Fields” pane.
Step 2: Create Tiers for Revenue
- The next step is to create tiers for revenue. Tiers are useful when we want to group data into different categories based on a specific criterion. In this example, we will create three tiers for revenue: low, medium, and high.
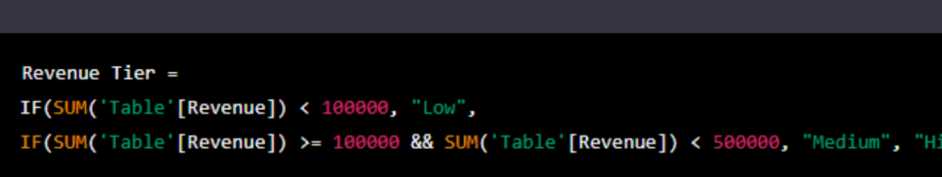
- To create tiers, we will use the “New Column” feature in Power BI. Click on the “New Column” button in the Modeling tab and enter the following formula:
- This formula creates a new column called “Revenue Tier” that categorizes the revenue data into low, medium, and high tiers based on the following criteria:
Low: revenue < $100,000
Medium: revenue >= $100,000 and < $500,000
High: revenue >= $500,000
Step 3: Perform Calculations Based on FTE
- The final step is to perform calculations based on FTE. In this example, we will calculate the revenue per FTE for each tier.
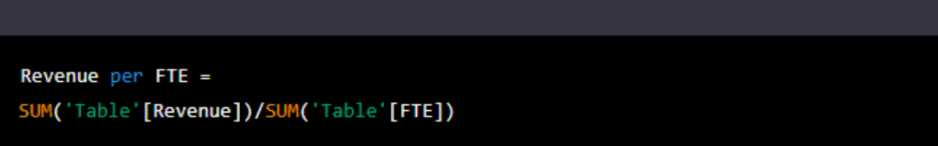
- To perform the calculation, we will use the “New Measure” feature in Power BI. Click on the “New Measure” button in the Modeling tab and enter the following formula:
- This formula creates a new measure called “Revenue per FTE” that calculates the revenue per FTE for each tier. We can then add this measure to a visual, such as a table or a chart, to see the results.
Step 4: Visualize the Data
- Now that we have created tiers for revenue and performed calculations based on FTE, we can visualize the data in Power BI. We can create a table or a chart that shows the revenue per FTE for each tier.
- To create a table, drag the “Revenue Tier” column and the “Revenue per FTE” measure to the Values field in the Fields pane. To create a chart, select the appropriate chart type, such as a column chart or a pie chart, and drag the same columns to the Values and Axis fields in the Fields pane
Conclusion of Full Time Equivalent
Full-Time Equivalent (FTE) calculations are an essential part of workforce management in many organizations. Power BI provides a powerful set of tools that can be used to perform FTE calculations, allowing organizations to make more informed decisions about their workforce. By following best practices and using advanced techniques, organizations can gain a more detailed understanding of their workforce and make more effective workforce management decisions.