In the fast-paced world of data analytics and business intelligence, Power BI remains at the forefront as a powerful tool that empowers organizations to transform data into meaningful insights. With each new release, Power BI introduces innovative features and enhancements that cater to the evolving needs of its users. The June 2023 feature summary brings a plethora of exciting updates that promise to enhance the user experience and broaden the capabilities of Power BI.
Enhanced Reporting Features:
Unveiling New Avenues for Data Visualization and Analysis
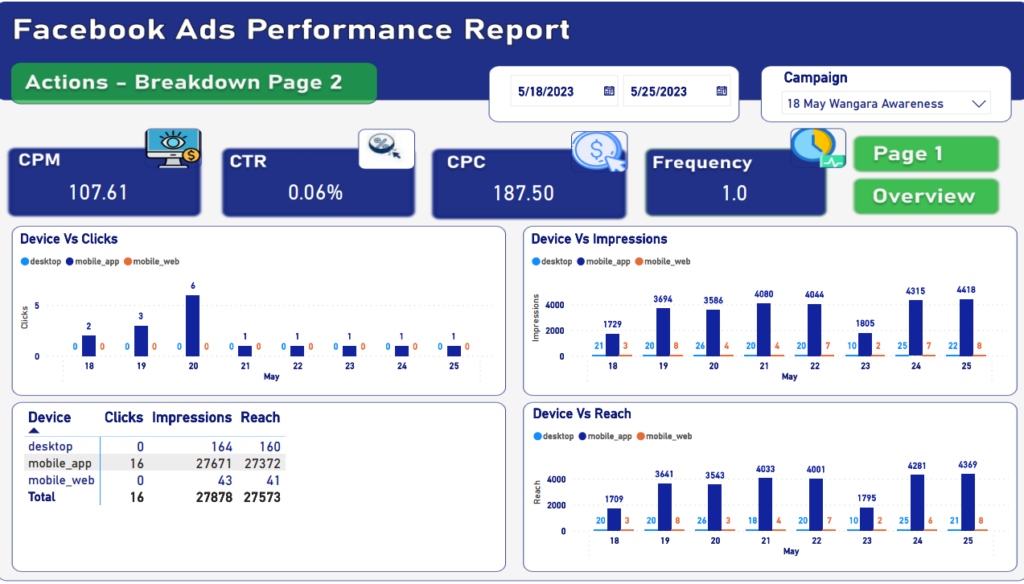
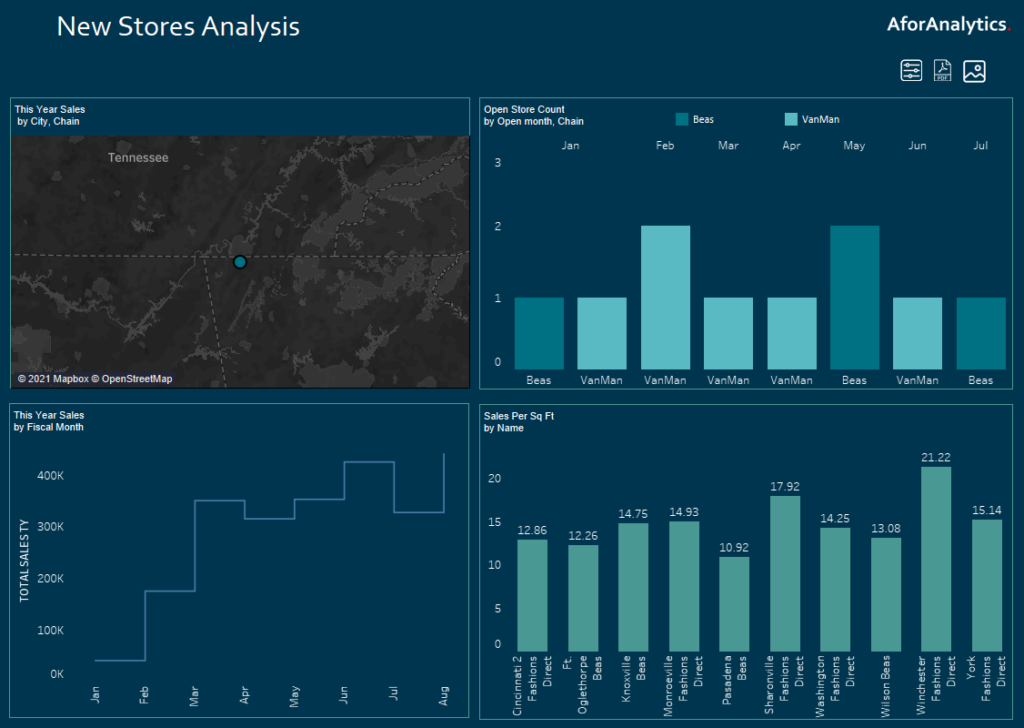
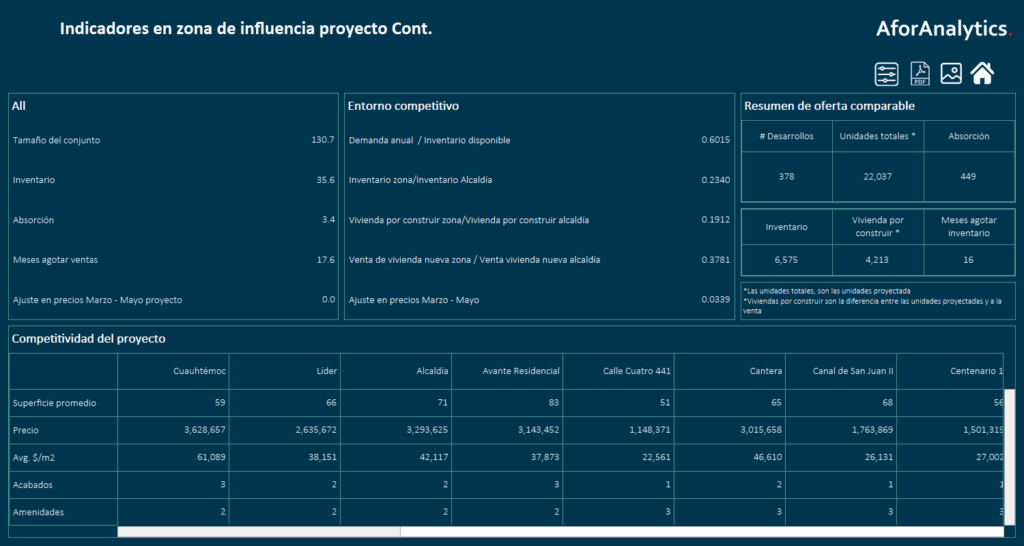
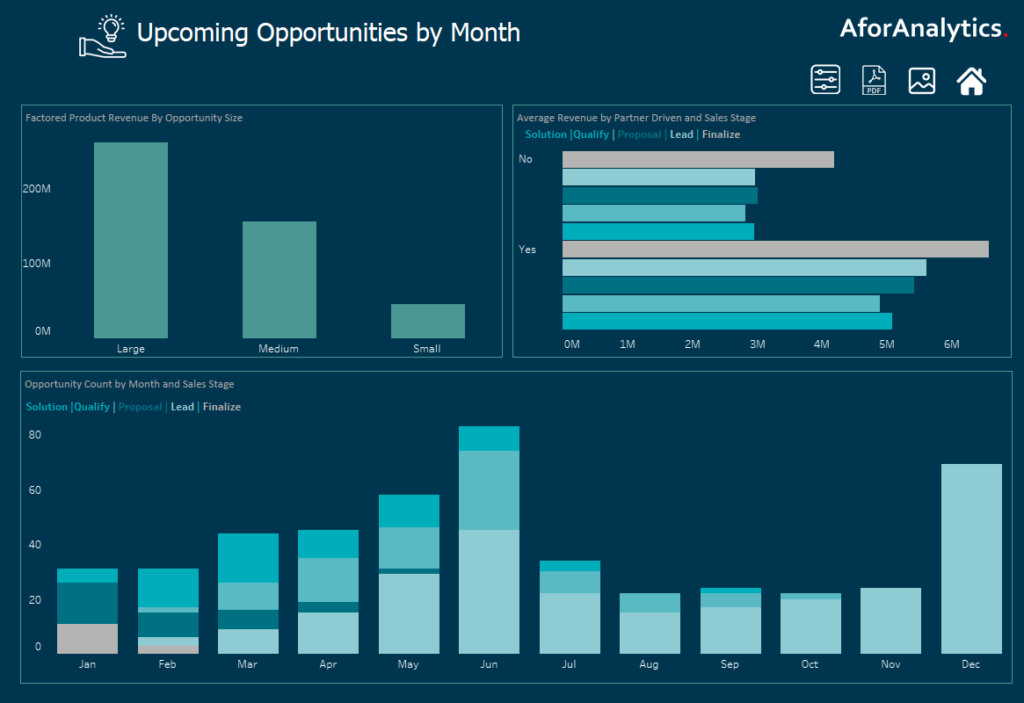
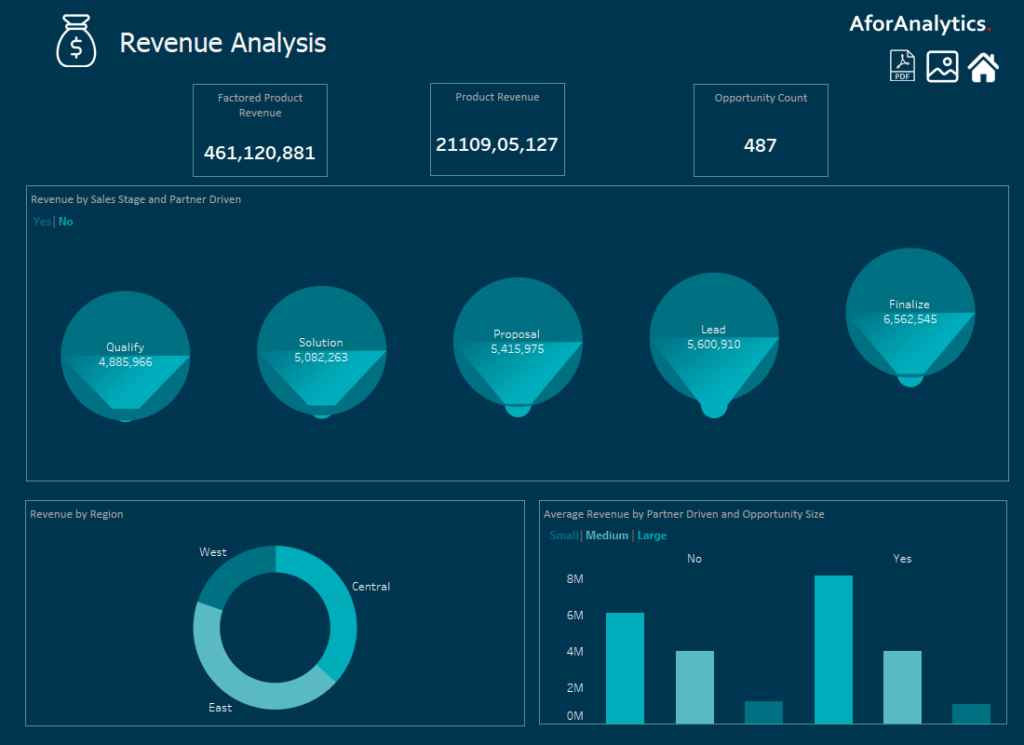
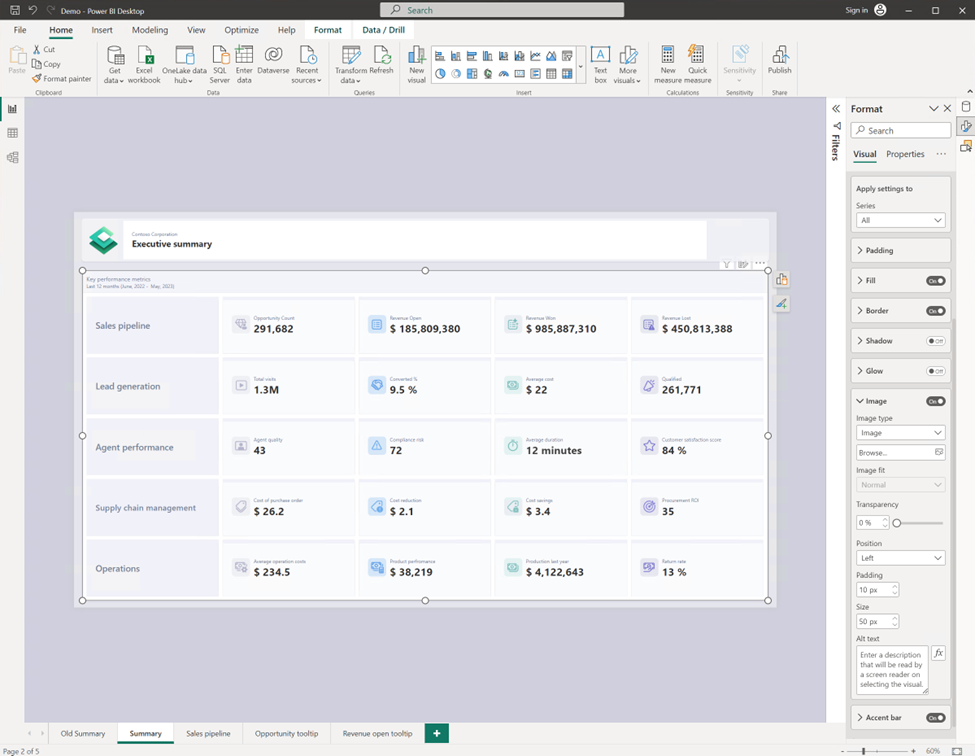
New Card visual
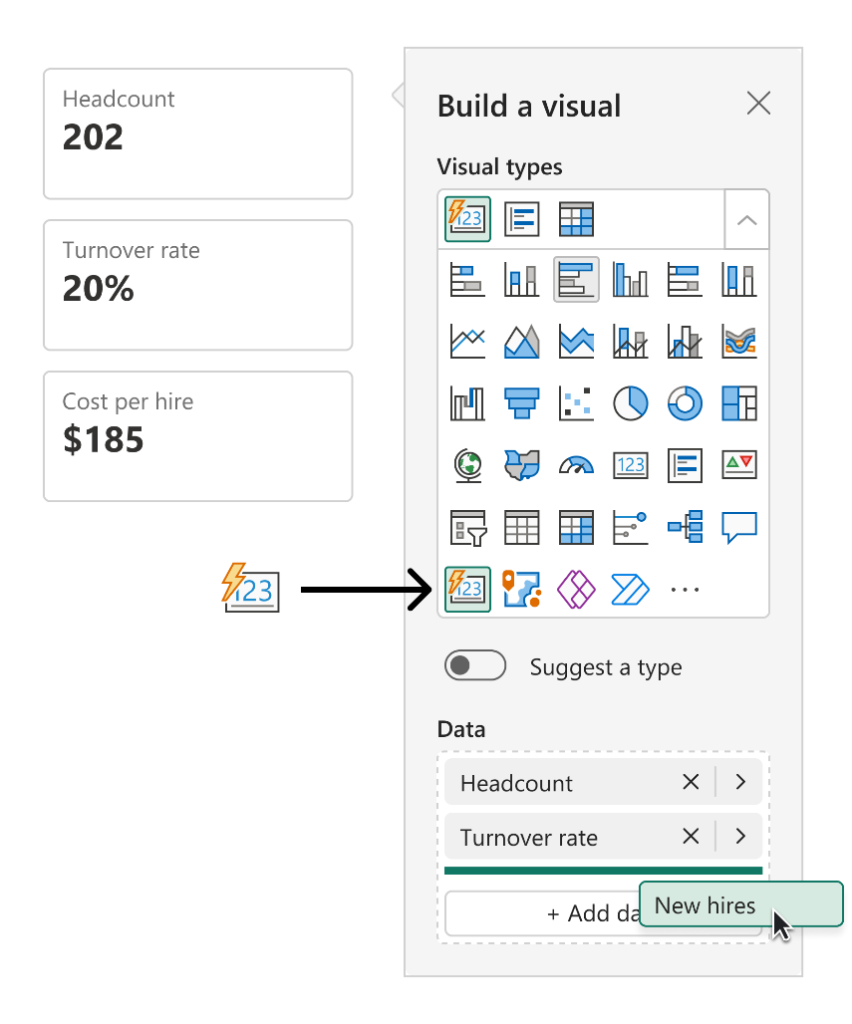
In this most recent release, we are excited to present our brand-new card visual functionality, conveniently located within the core visual gallery. Alternatively, you can access it as a preview feature by navigating to Options > Preview features > New card visual. To exhibit numerous cards, simply achieve this by effortlessly dragging and dropping your selected fields or measures into the designated ‘Data’ field well.
The new card visual comes with special surprises that include:
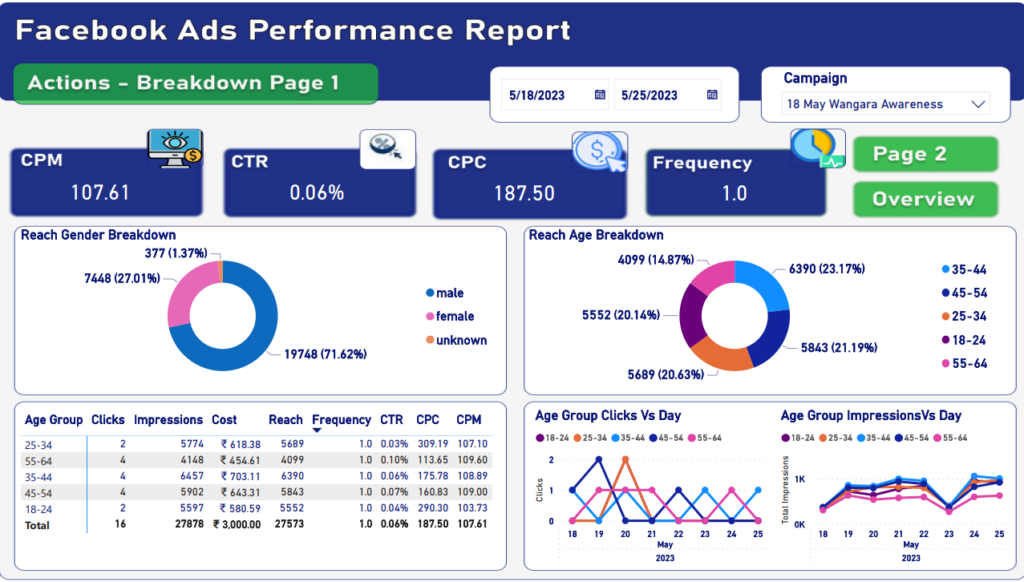
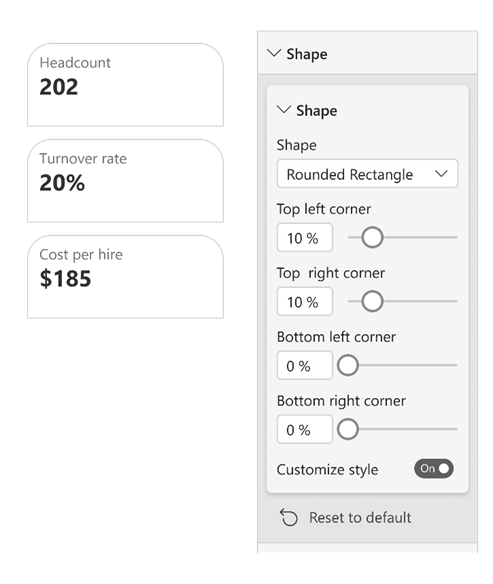
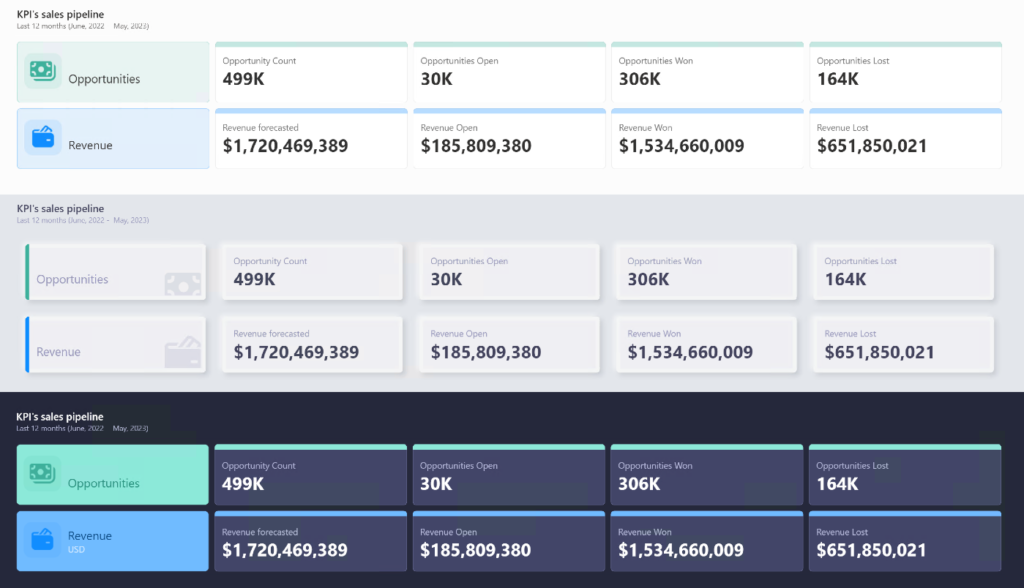
- Customize the shape corners to achieve your desired style.
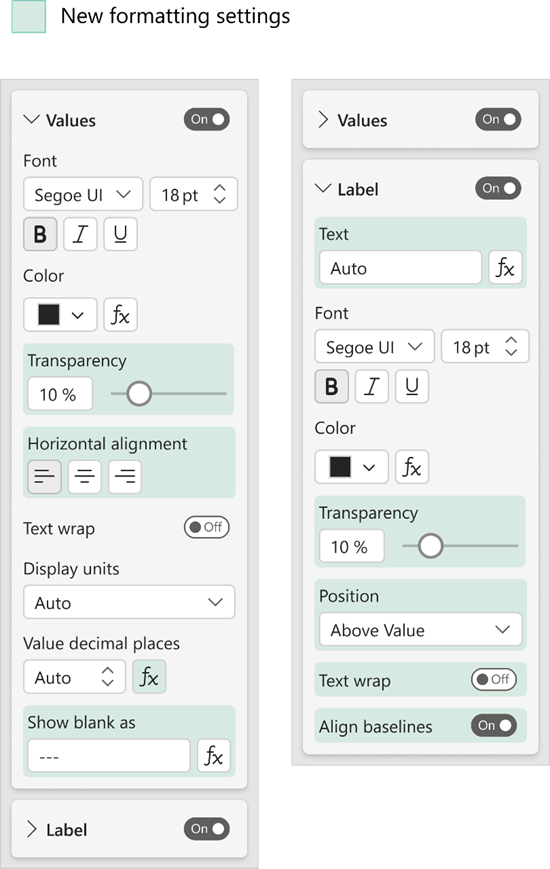
- Refined formatting settings for values and labels, with expanded support for conditional formatting and the introduction of font transparency.
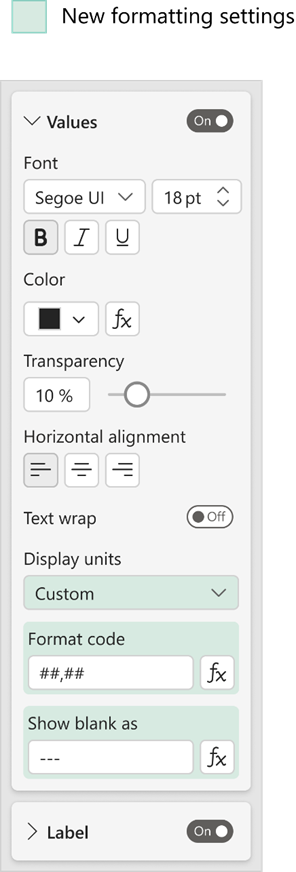
- Achieve meticulous control over your display units through the newly introduced custom option, allowing you to tailor the presentation precisely to your needs. Furthermore, guarantee accurate content presentation on your cards, even in the absence of data, utilizing the innovative ‘Show blank as’ feature.
- Choose from three layouts (Horizontal, vertical, and grid) and fine-tune your cards by adjusting the padding, spacing, and text alignment.
- Take your design to the next level with the addition of ‘Image’ and ‘Accent bar’.
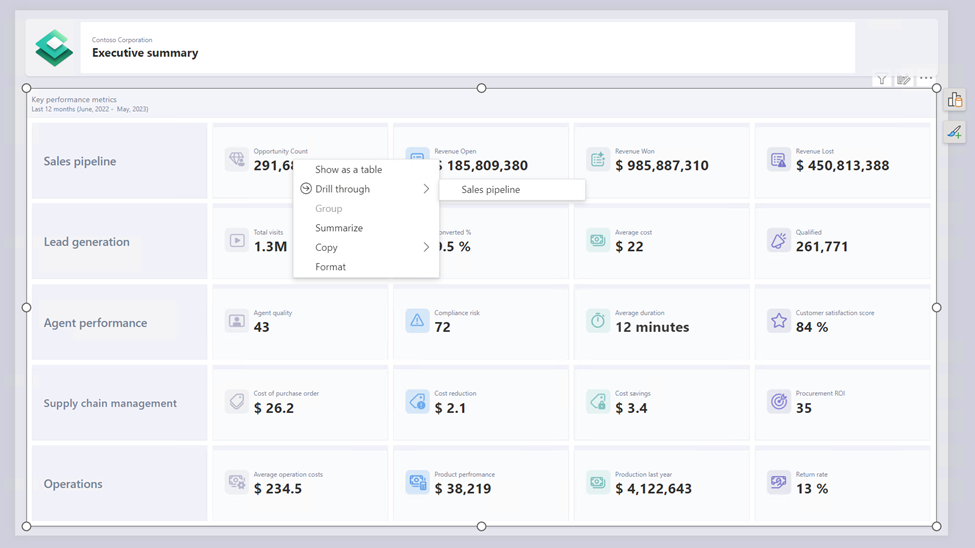
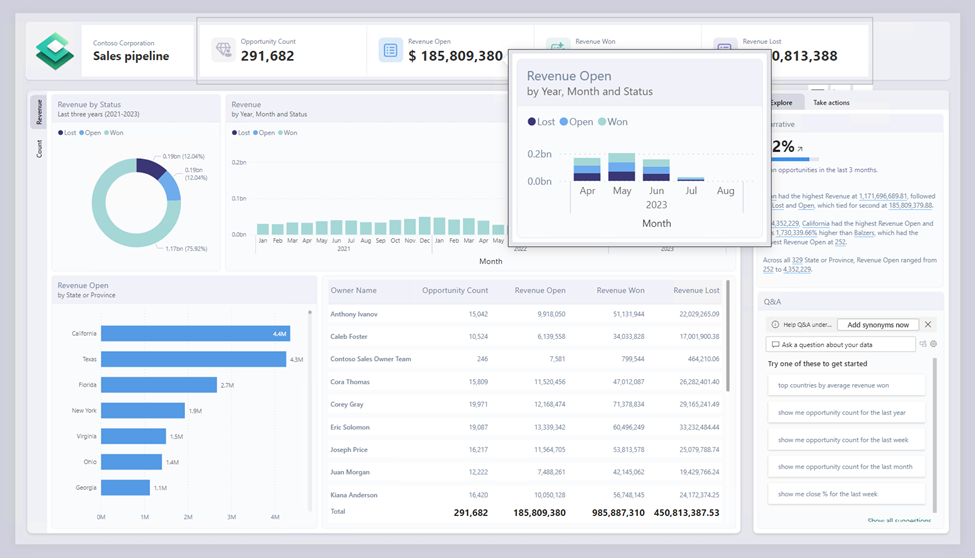
Bring your data to life with interactivity features like tooltips and drill through.
OneLake data hub in Power BI Desktop
Introducing the centralized data hub within Power BI Desktop, now unveiled as the “OneLake data hub” under our recent Fabric release. This enhancement facilitates the discovery and efficient reuse of data resources.Within the OneLake Data Hub in Power BI Desktop, you gain the ability to not only repurpose existing Fabric components but also forge your own datasets and reports atop them. This versatile hub accommodates a range of items, including data warehouses, lakehouses, associated SQL endpoints, datamarts, and datasets (with upcoming support for KQL databases later this year).
For lakehouses and their corresponding SQL endpoints, as well as datamarts and warehouses, you have a duo of options for data retrieval:
- Connect to the auto-generated dataset that underlies the component.
- Establish a direct connection to the SQL endpoint, allowing you to create a customized dataset.
The OneLake data hub in Power BI Desktop acts as your conduit to the extensive Fabric data ecosystem, providing streamlined access and fostering enhanced data utilization.
On-Object Interaction – Updates
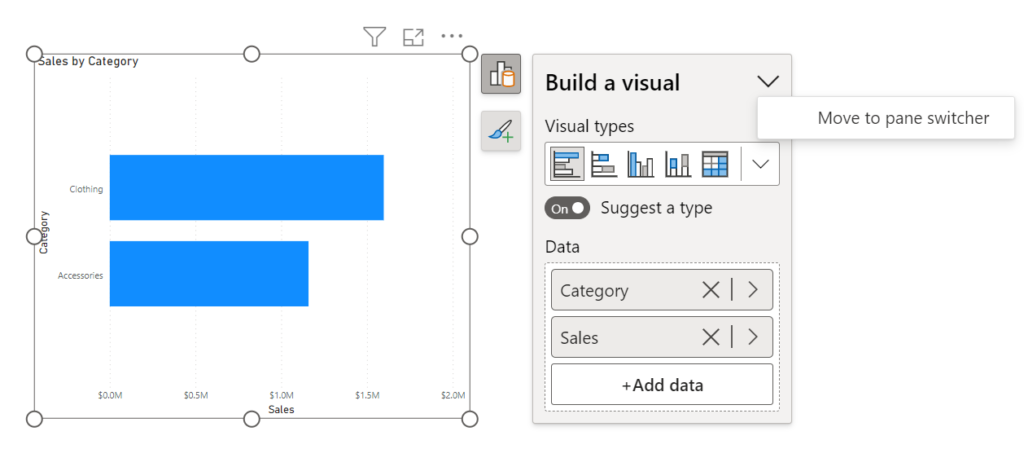
The new on-object interaction feature released to preview in March. This month we bring the top improvement requested, the ability to re-attach the build menu as a pane!
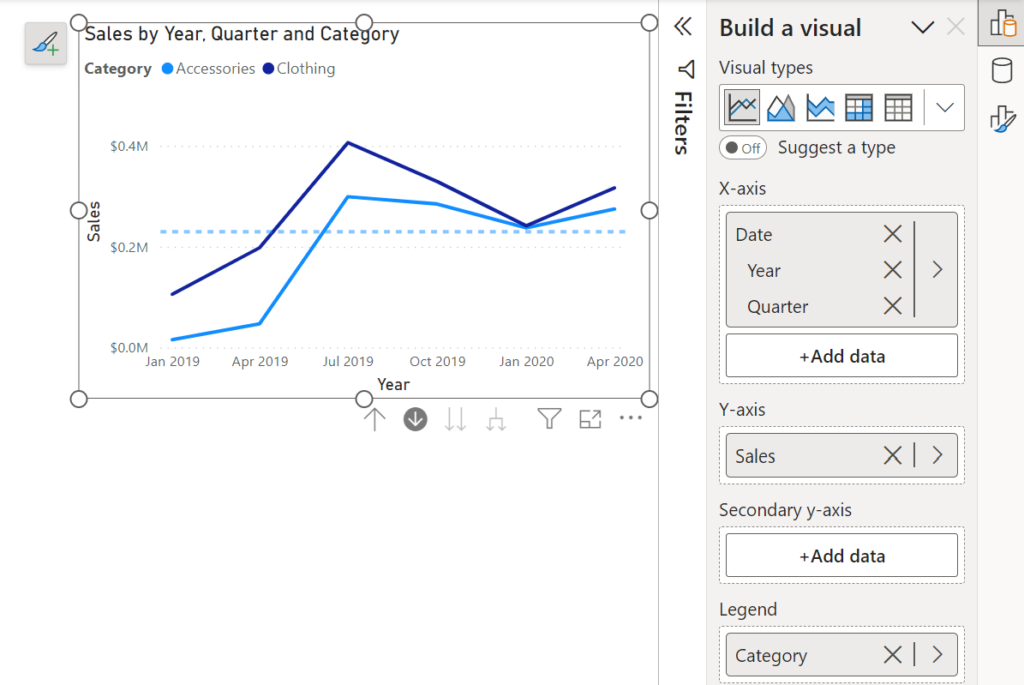
Now users can attach the build menu to the pane switcher by 1 of 3 ways:
- Directly from the on-object button:
2. From the View ribbon:
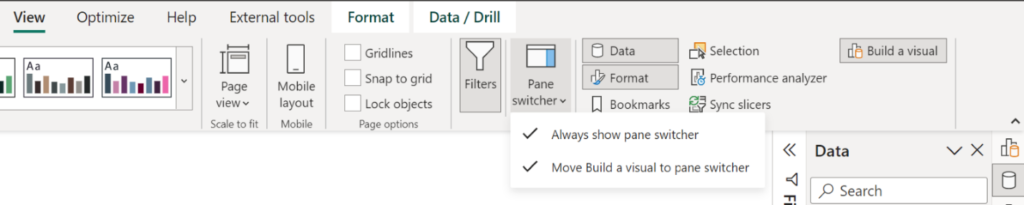
3. From the options menu:
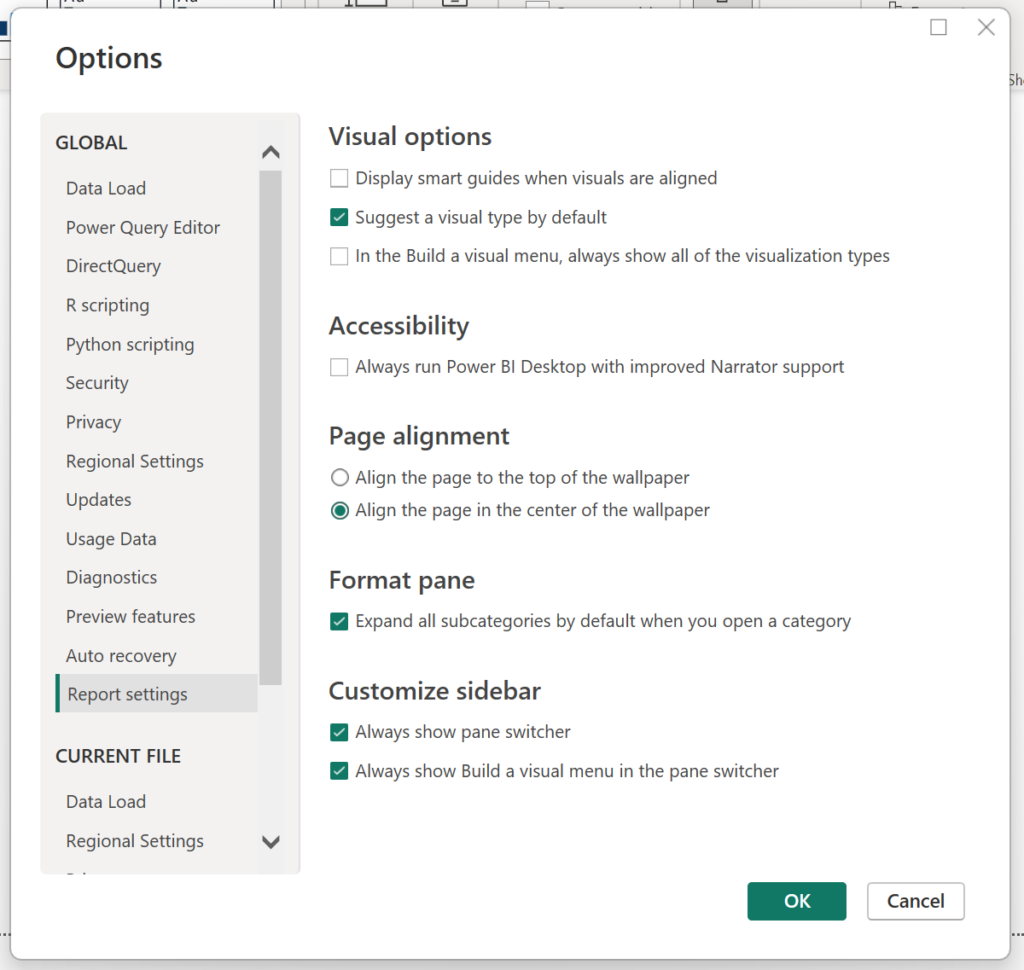
In addition to the reintroduction of the build menu attachment option, we’ve introduced a user-friendly setting that enables users to keep the pane switcher perpetually visible. Notably, both of these innovative settings are designed to maintain consistency across your reports.
Stay tuned for further enhancements in the upcoming month, as we’re set to introduce two exciting features to the pane switcher. The first is an “add” button directly integrated into the pane switcher, allowing seamless creation of new panes without navigating to the ribbon. Furthermore, we’re introducing the ability to preserve these newly added panes across various reports, enhancing cross-report continuity.
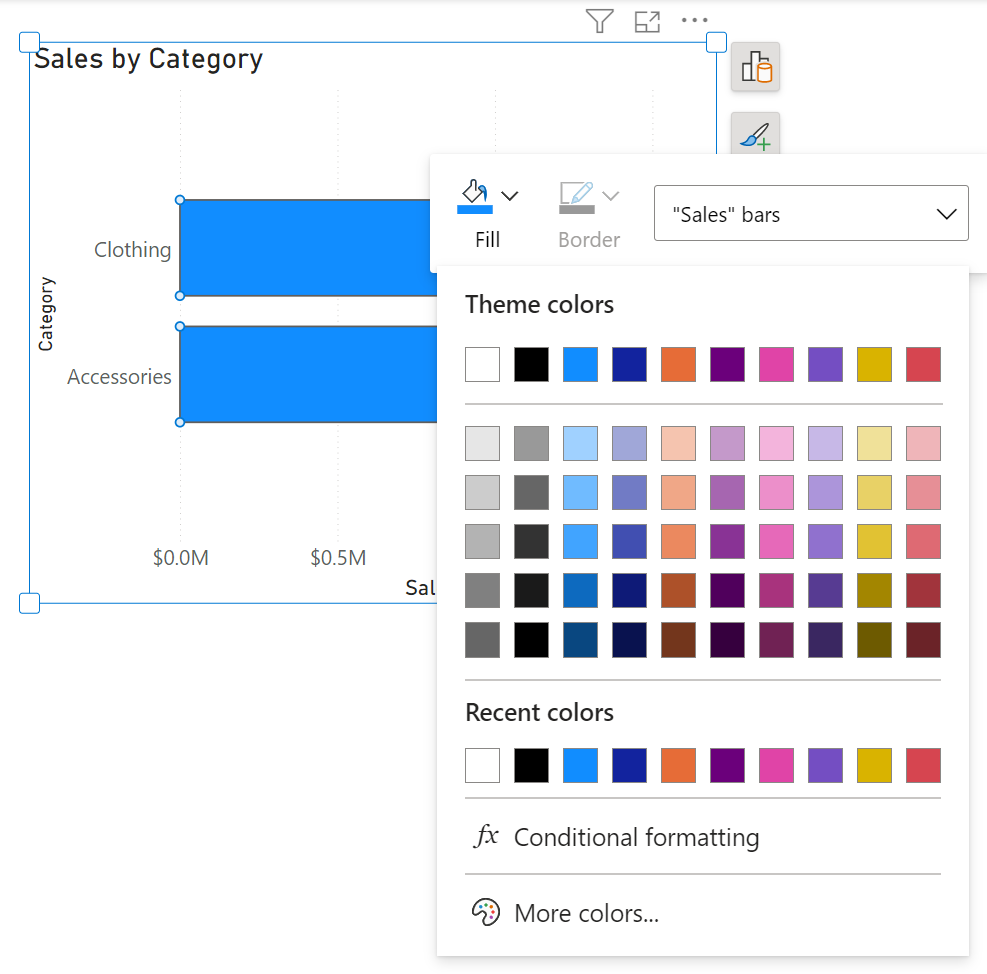
This month’s update also encompasses a valuable addition: the capability to establish and modify conditional formatting directly from the on-object mini toolbars. This enhancement streamlines the formatting process and contributes to an optimized user experience.
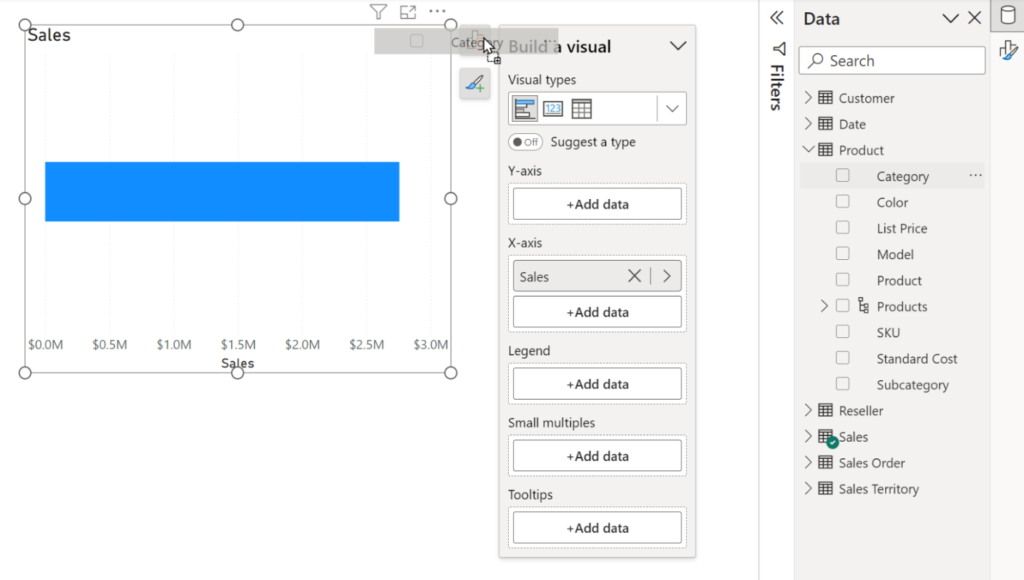
As well as drag/drop precision improvements within the on-object build menu’s field wells, including auto-opening the build menu when dragging a field:
In this article, we have thoroughly explained Reporting features. In our next blog post, we will cover Data Connectivity and Preparation, Service, and Developer updates.
If you require Power BI consulting, we’re here to assist you in achieving enhanced analytics. A for Analytics offers expert Power BI consulting services.
This article is derived from the source: https://powerbi.microsoft.com/en-us/blog/power-bi-june-2023-feature-summary/#post-23927-_Toc137015471