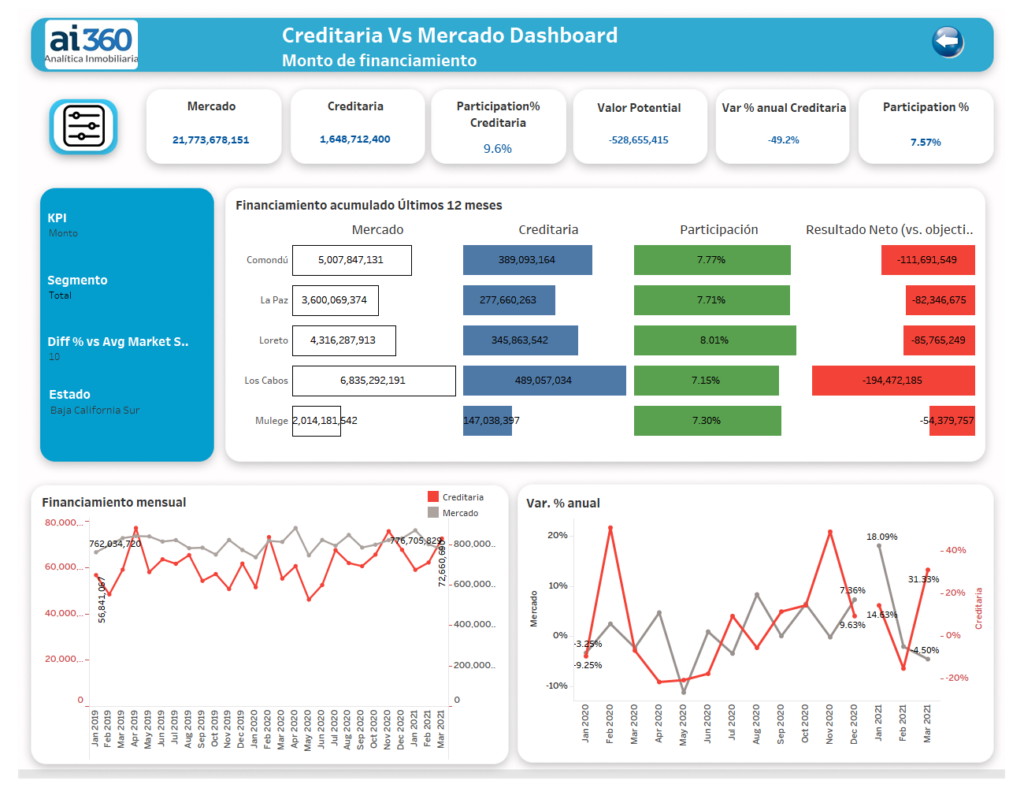
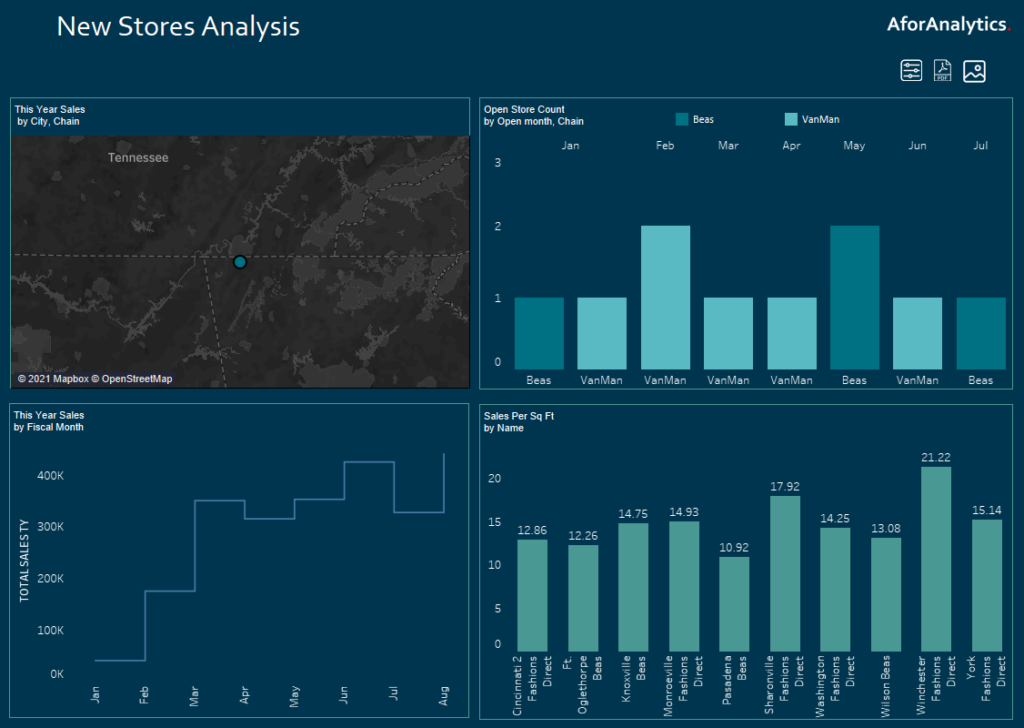
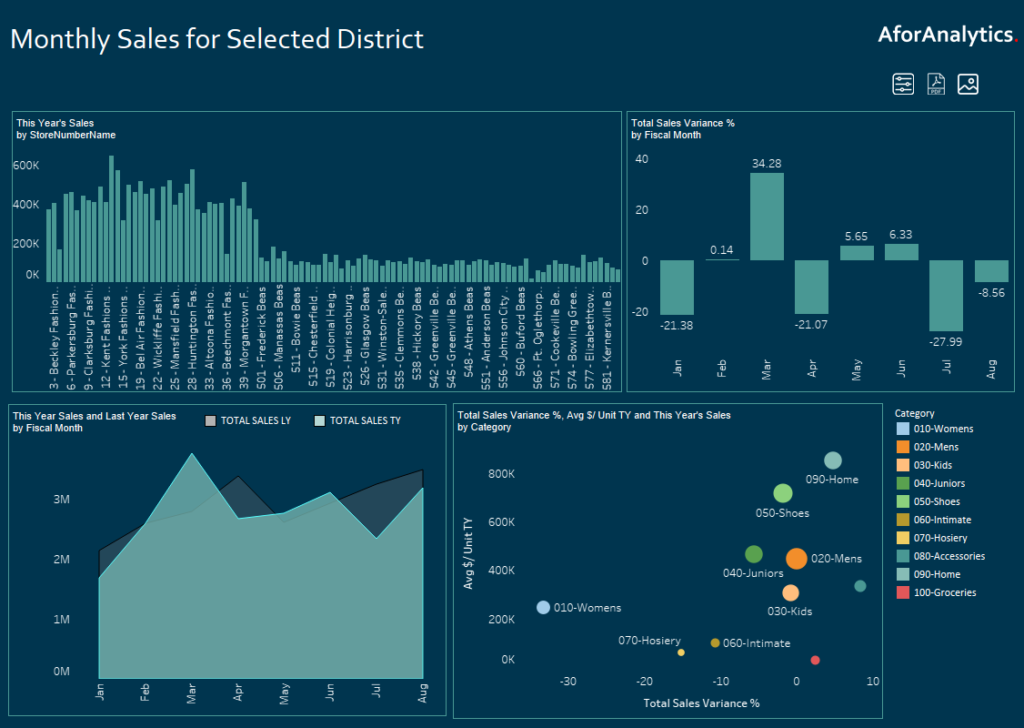
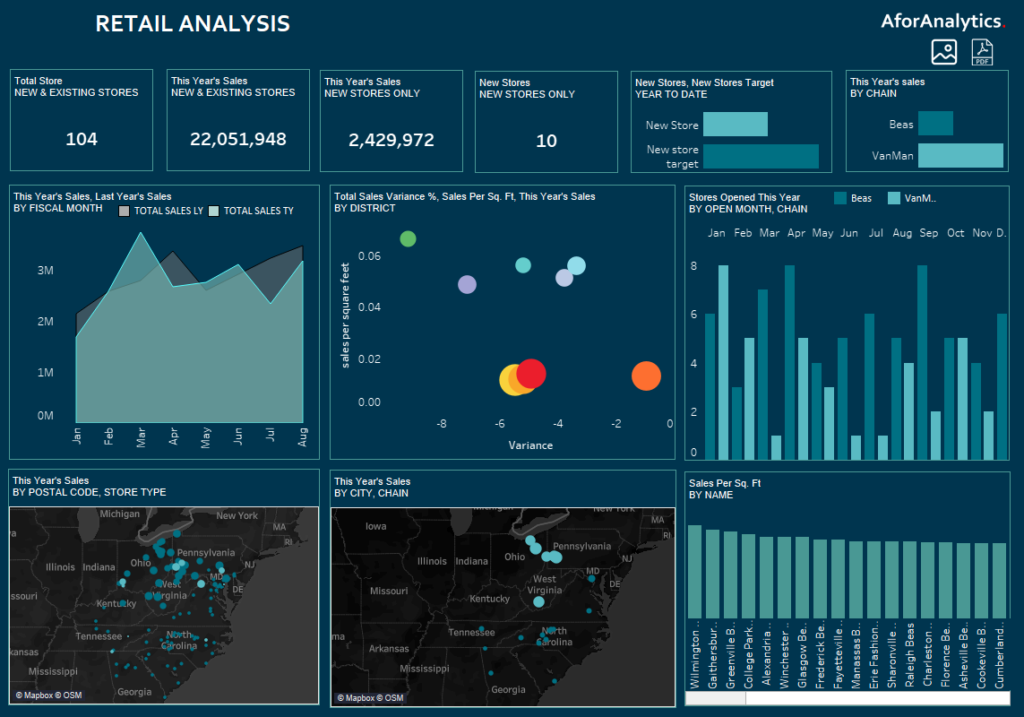
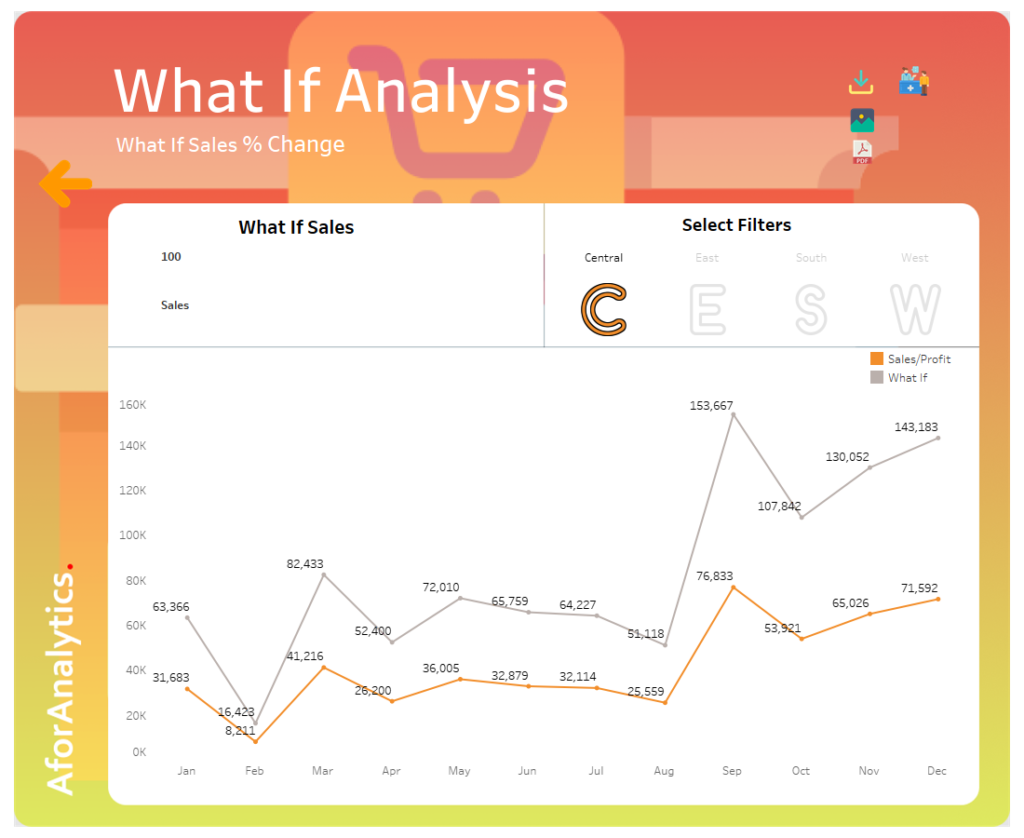
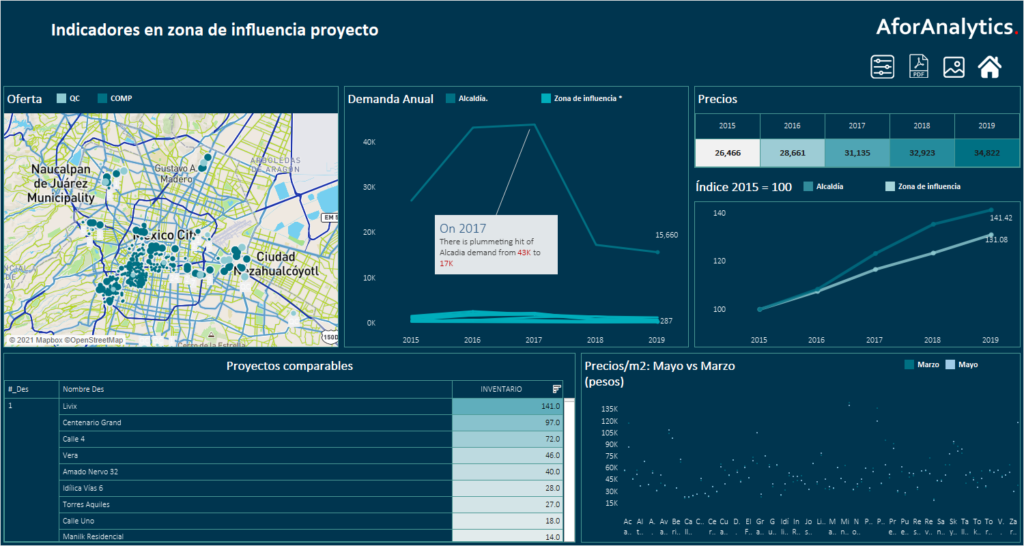
Viz in Tool tip allows you to place visualizations into tool tips, revealing them on hover or selection of individual marks and the data in the viz is automatically filtered to the mark.
Getting Started
For this tutorial, we will use US Map showing profit ratio so when user hover or select the state they will see the Top 10 Sub category in the tool tip.
First, we need to create a new sheet build a US map that contain profit ratio in the color marks card and when user hovers over the Map we need to setup a bar chart pop up as a tool tip to show top 10 sub category.

Tableau USA Map
Next, we need to create a second sheet to build a simple bar chart to show top 10 sub category. We have used a INDEX() function, it’s a Tableau Table calculation returns row number, it’s a row number and keep in a filter shelf with TRUE. Once you created the Calculation it’s shows T or F meaning, it’s a boolean function.


To add this bar chart sheet as a tooltip in the map, I need to navigate back to the first sheet,
click the Tooltip Marks Card, click the Insert button in the top-right corner of the tooltip dialog box that appears, hover over sheet, and choose the List sheet.
You can make the formatting as you like in Tool tip dialogue box.

Once you have added second sheet to the tooltip now you can hover over the map and able to see Top 10 sub categories based on cities.

What if you need Bottom 10 sub categories?
Very simple! Just sort profit measure ascending to descending to get bottom 10 sub categories.
To your success,
Saravana
A for Analytics


